- Bitcoin Miner Stocks Report
- Posts
- Miner Chart Watch: Weekly Bitcoin-Mining Stocks Analysis for March 29, 2026
Miner Chart Watch: Weekly Bitcoin-Mining Stocks Analysis for March 29, 2026
Straight price-action snapshots and technical notes.
Christopher Inks
March 29, 2026

In partnership with
The Key to This $240B Market Is in Your Bloodstream

Every year, $240B is spent on treating the symptoms of osteoarthritis. But not a single therapy has been able to actually stop it. The answer, it turns out, has been inside us all along.
A startup named Cytonics discovered the human body already produces a protein designed to protect cartilage. It just doesn’t produce enough where it's needed most. So Cytonics harnessed it.
Their first-generation therapy has already treated 10,000+ patients. Now they've engineered a 200% more potent, mass-producible version pushing toward FDA approval.
If approved, it could be the first therapy to actually halt cartilage destruction and promote regrowth in a market that has never had a real solution. Claim a piece at the pre-clinical stage as an early-stage investor before March 26 to receive time-sensitive investor bonuses.
This is a paid advertisement for Cytonics Regulation CF offering. Please read the offering circular at https://cytonics.com/
1. RIOT Blockchain ($RIOT)
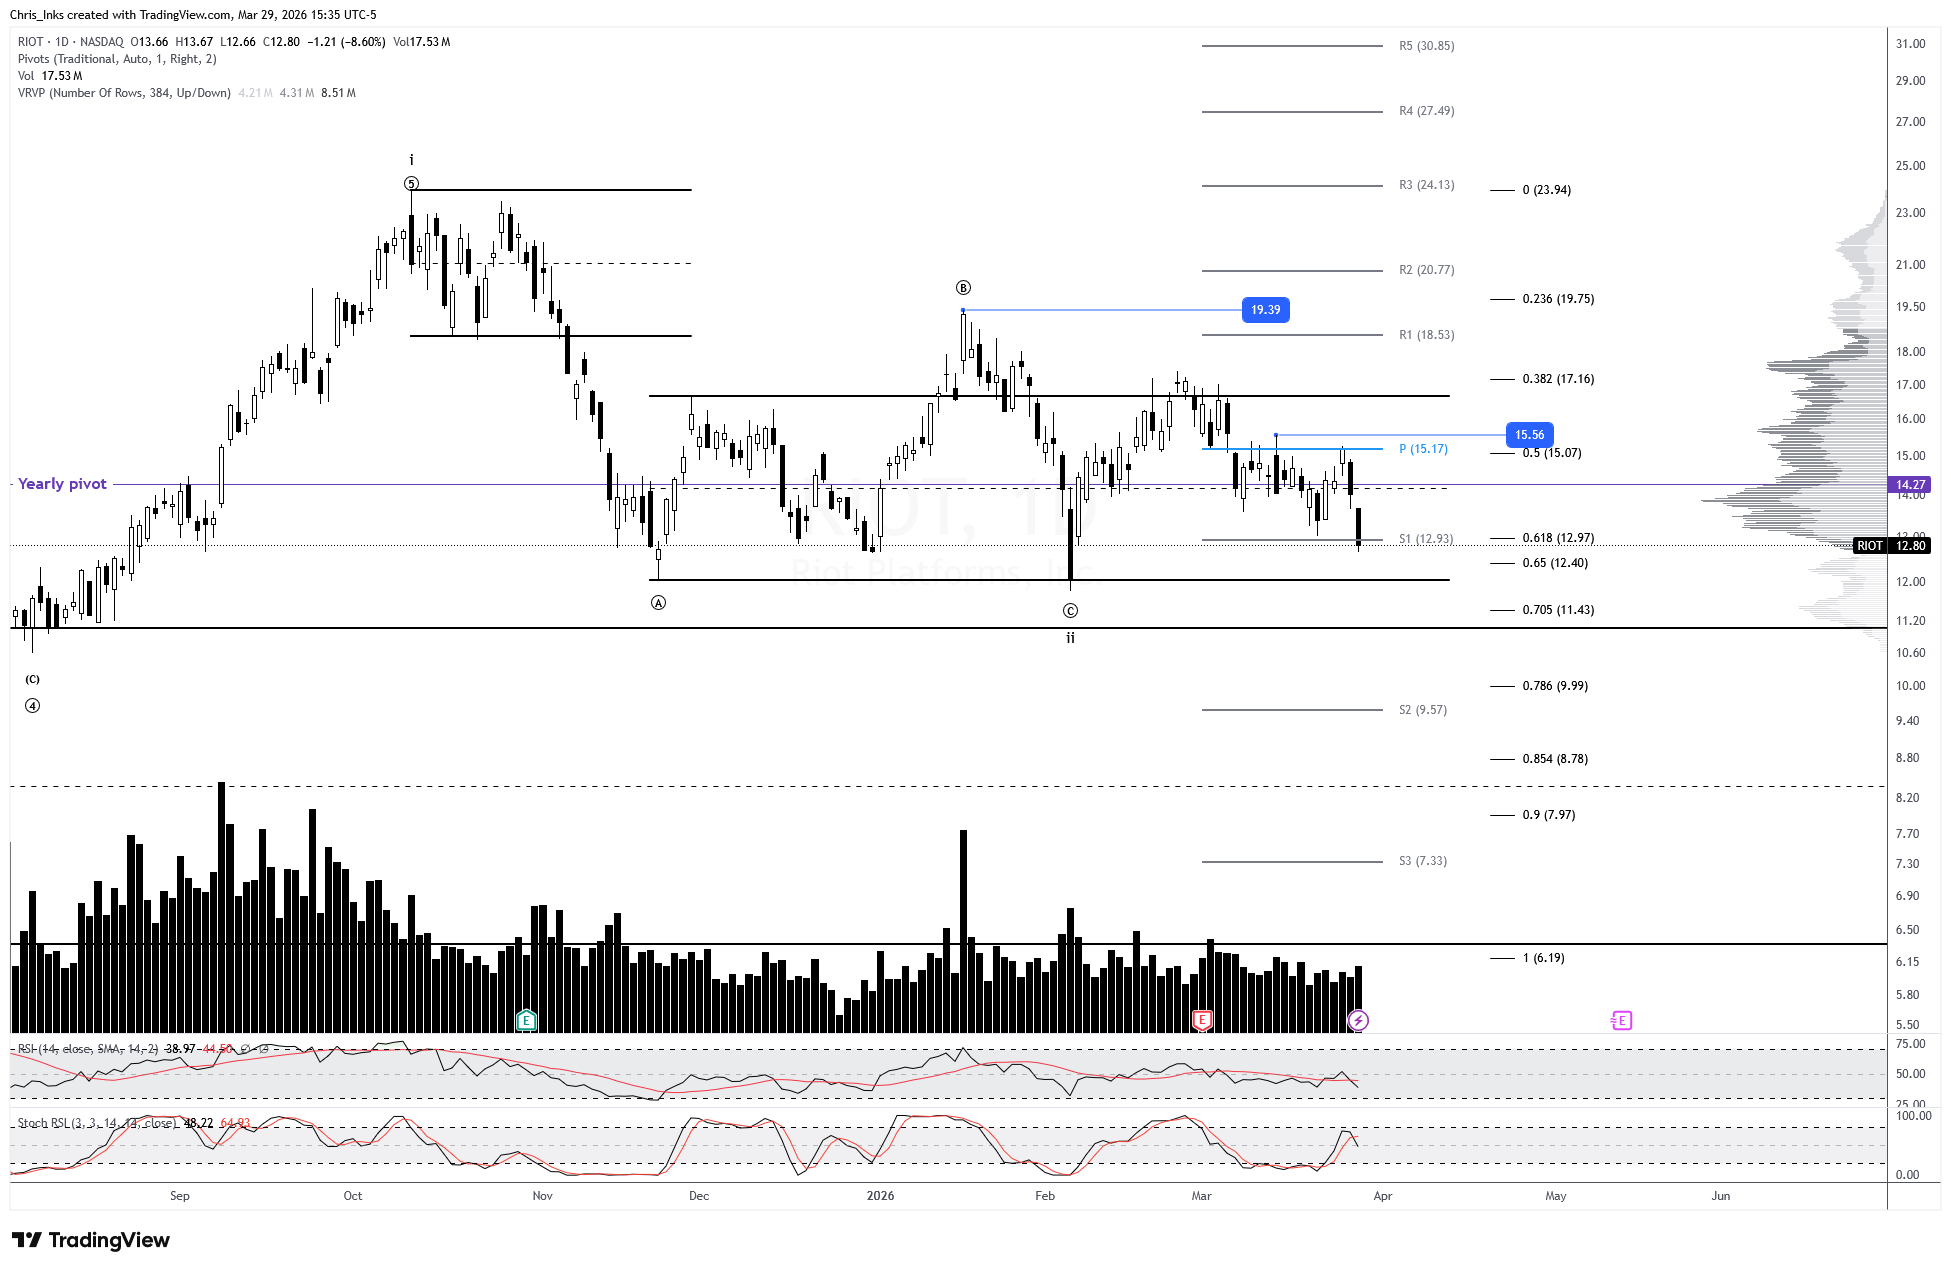
Price bounced into the monthly pivot by Wednesday, was rejected, and pulled back below the local swing low around the monthly S1 pivot by the end of Friday. Daily RSI still has not reset into oversold, so traders should remain cautious for now. A breakout above 15.56 should indicate that the pullback is likely complete. Further break out above wave ((B)) at 19.39 will add confidence to the count and indicate that wave iii is likely in progress toward a minimum expected target of ~40.60.
Breaking down below wave ii will keep wave ii alive with a target of the 78.6% retraement level at 9.99.
*Target placement is not based on time. I only focus on the target levels.
2. Marathon Digital Holdings ($MARA)
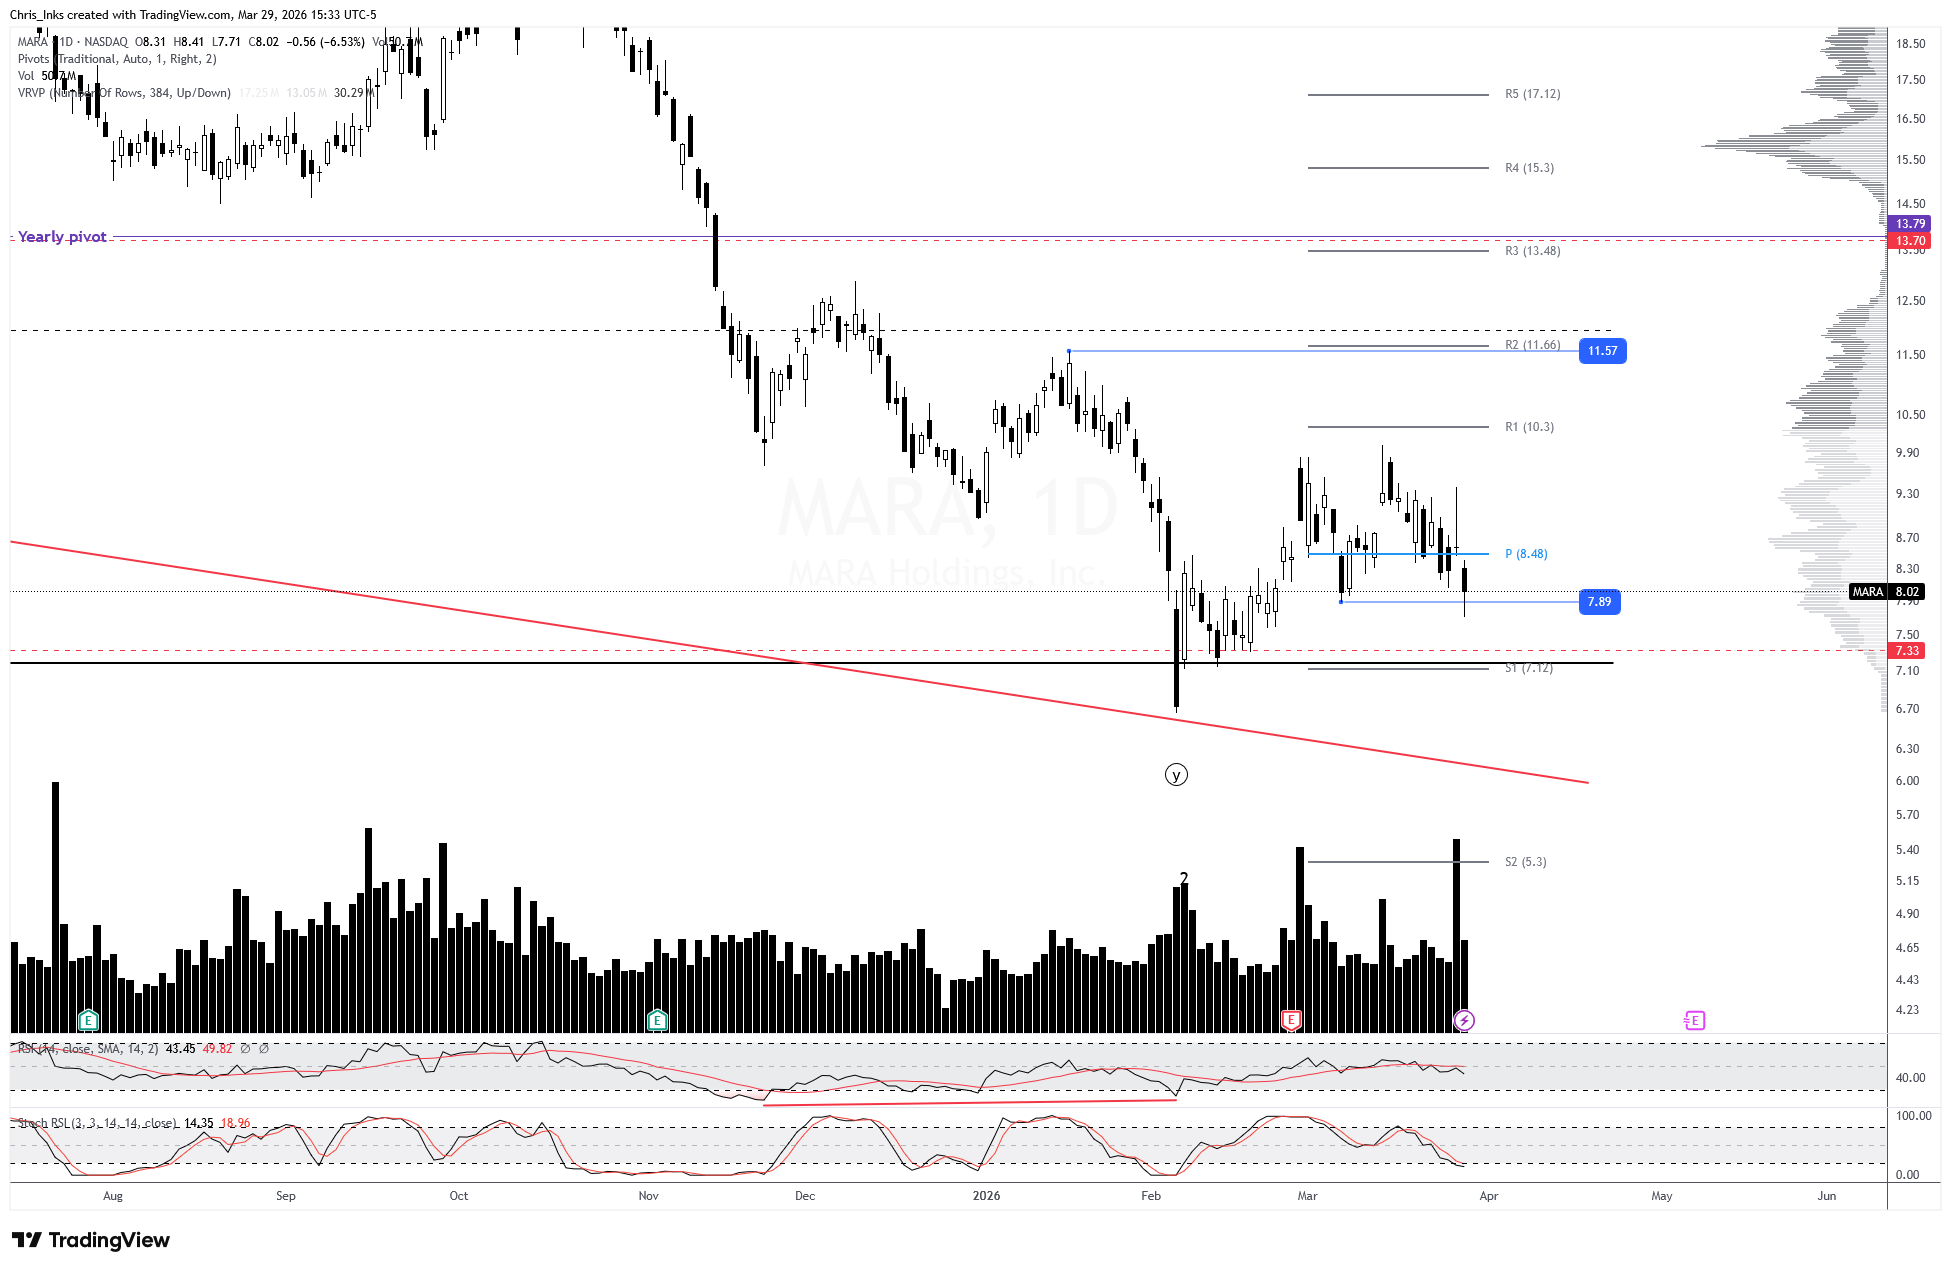
Price swept the 7.89 swing low and then immediately closed back above it. Further decline below that swing low from last week will give us an initial downside target of the monthly S1 pivot at 7.12.
Breaking out above 11.57 will break the bearish market structure off the wave 1 extreme and set up a move toward the wave ((x)) extreme. As mentioned previously, it’ll take a break out above that wave ((x)) extreme at 30.28 to confirm the wave 2 count. Wave 3 has a minimum expected target of 57.25.
*Target placement is not based on time. I only focus on the target levels.
3. CleanSpark ($CLSK)
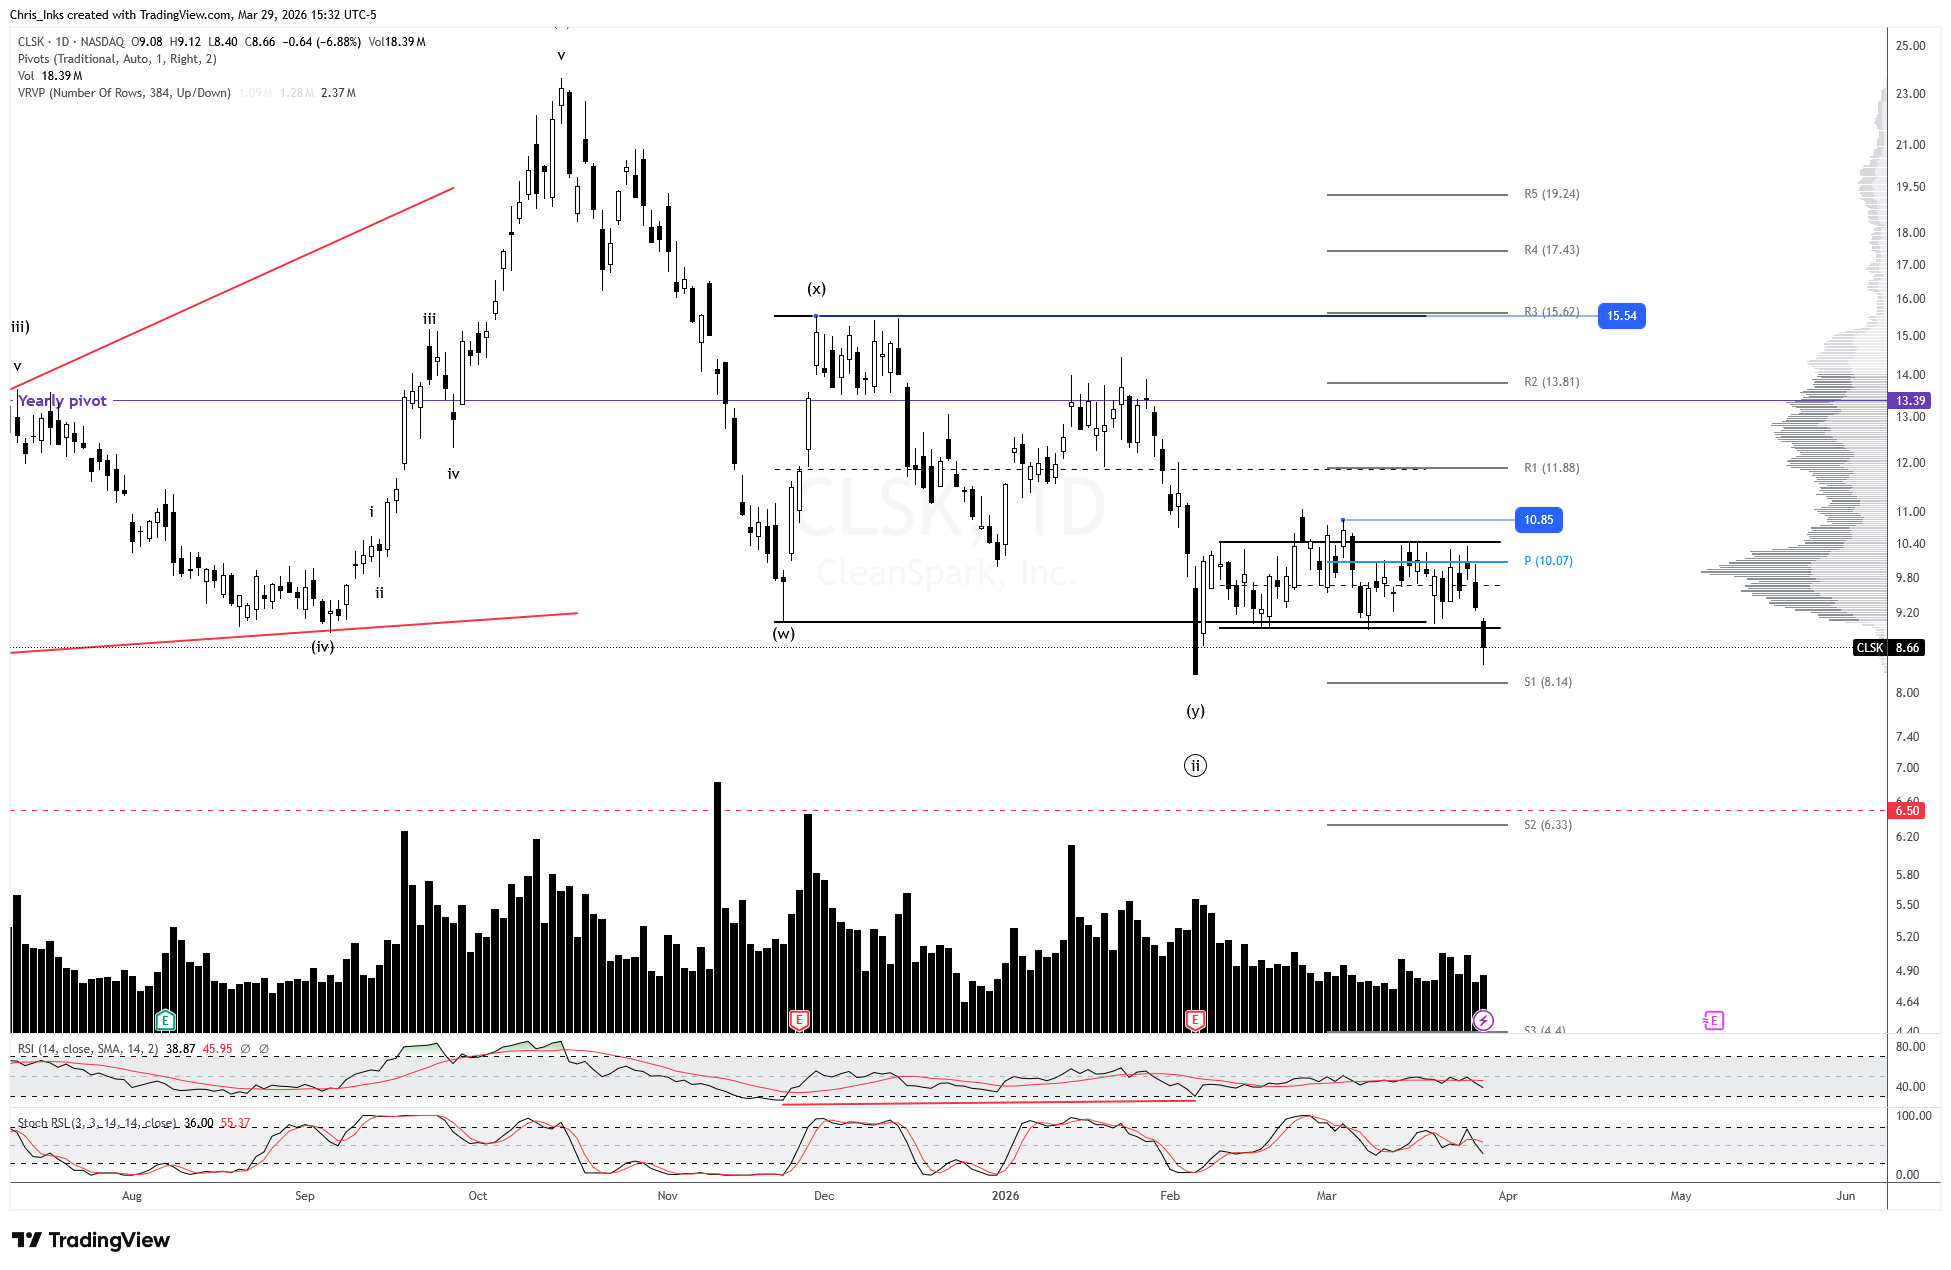
Price broke down further, carrying below the range support, and almost reaching the target area of the monthly S1 pivot at ~8.14. Further breakdown will have that as the initial downside target, followed by a pattern target of ~6.50.
Breaking out above 10.85 will signal that the pullback is probably complete. Further break out above wave (x) resistance at 15.54 will add confidence to the count. Wave ((iii)) has a minimum expected target of 36.00.
*Target placement is not based on time. I only focus on the target levels.
4. Bitfarms Ltd. ($BITF)
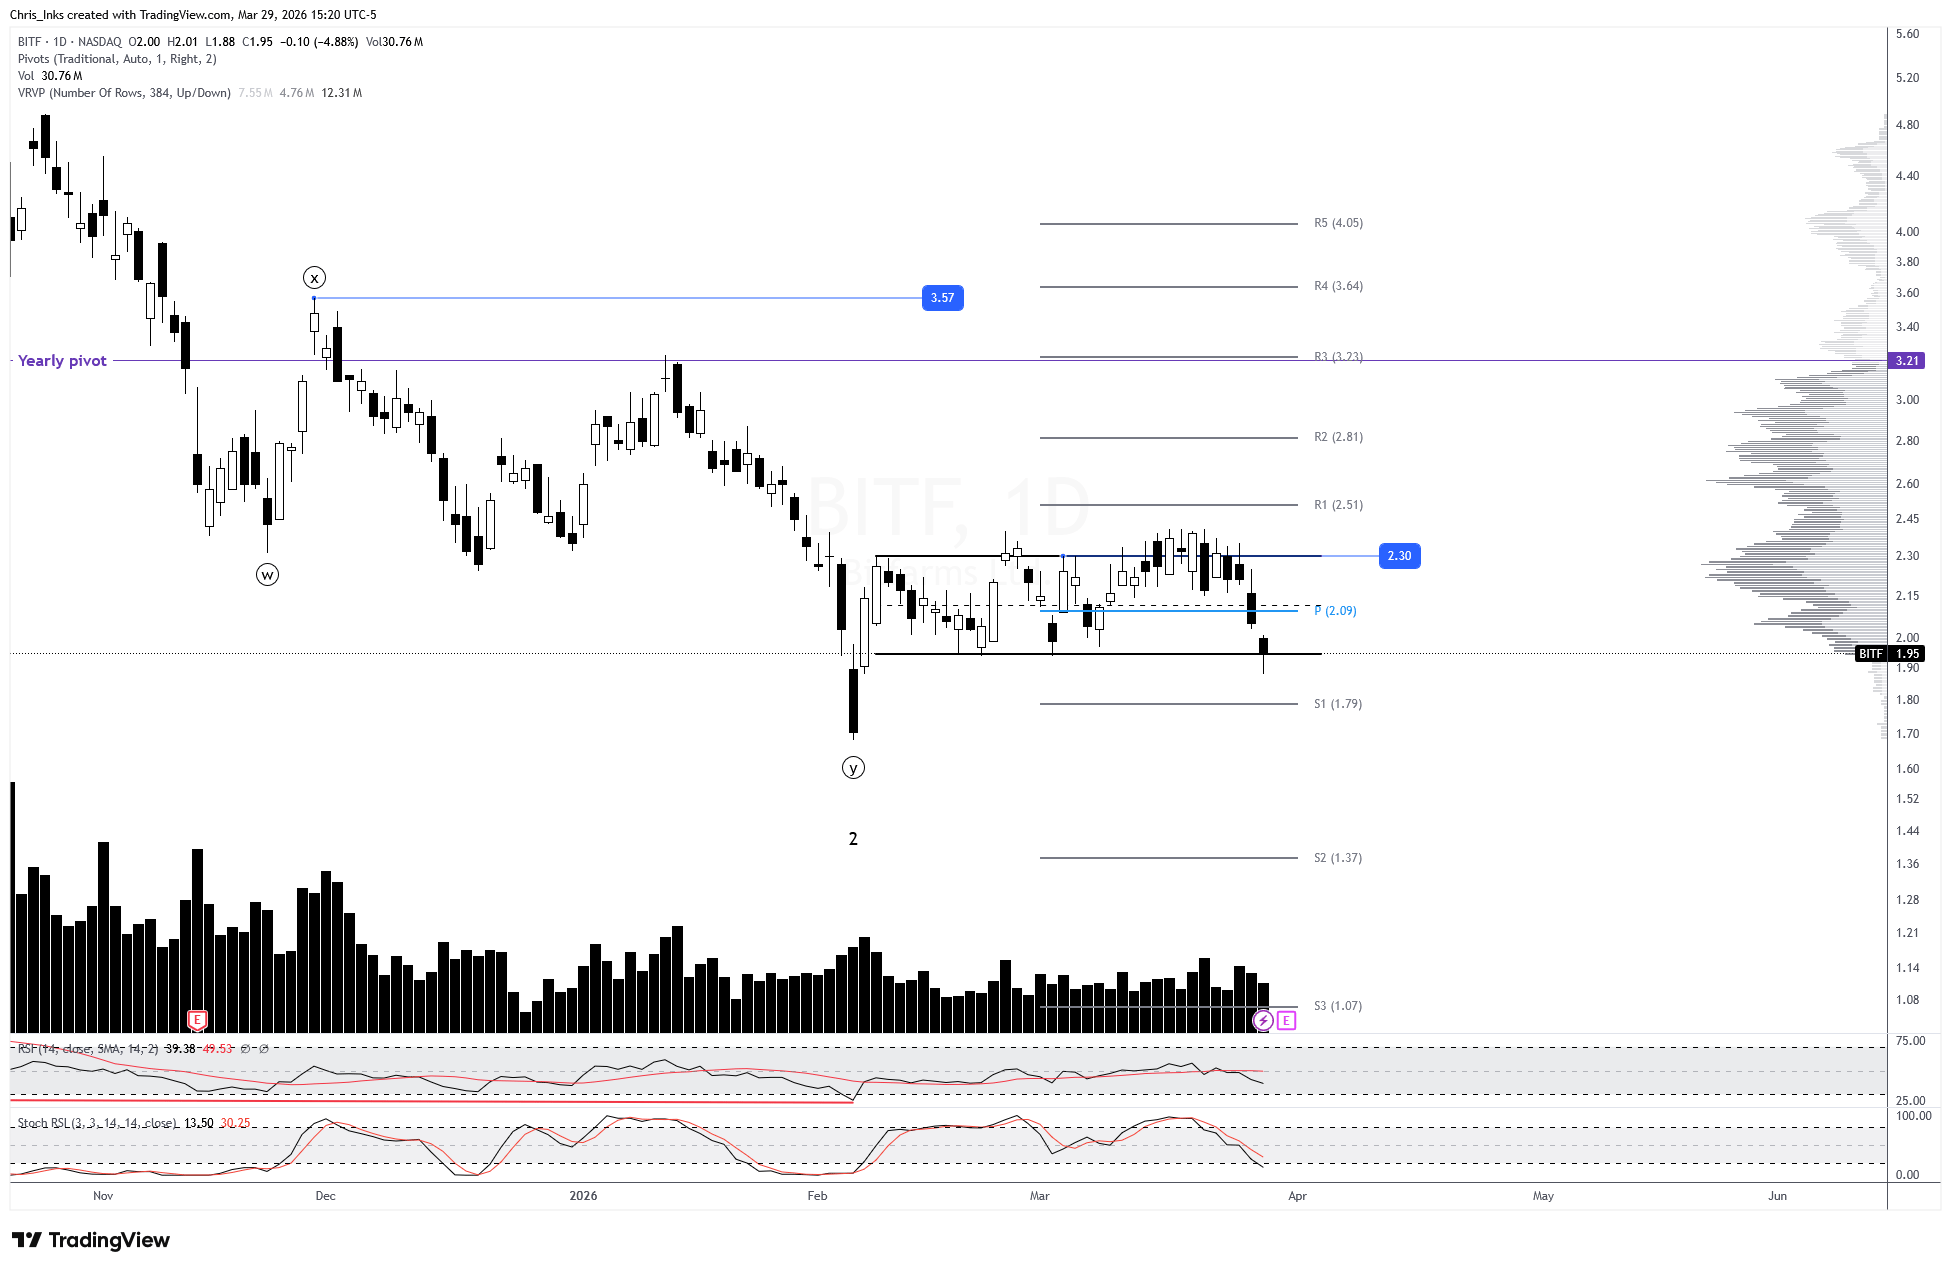
Price swept range support, but managed to close just back inside the range. A breakdown below last week’s swing low will give us an initial downside target of the monthly S1 pivot at 1.79.
Breaking out and closing above 2.30 should likely indicate that the pull back is complete. Further break out above wave ((x)) resistance at 3.57 will add confidence to the count. Wave 3 has a minimum expected target of 11.25.
*Target placement is not based on time. I only focus on the target levels.
5. Hut 8 Corp. ($HUT)
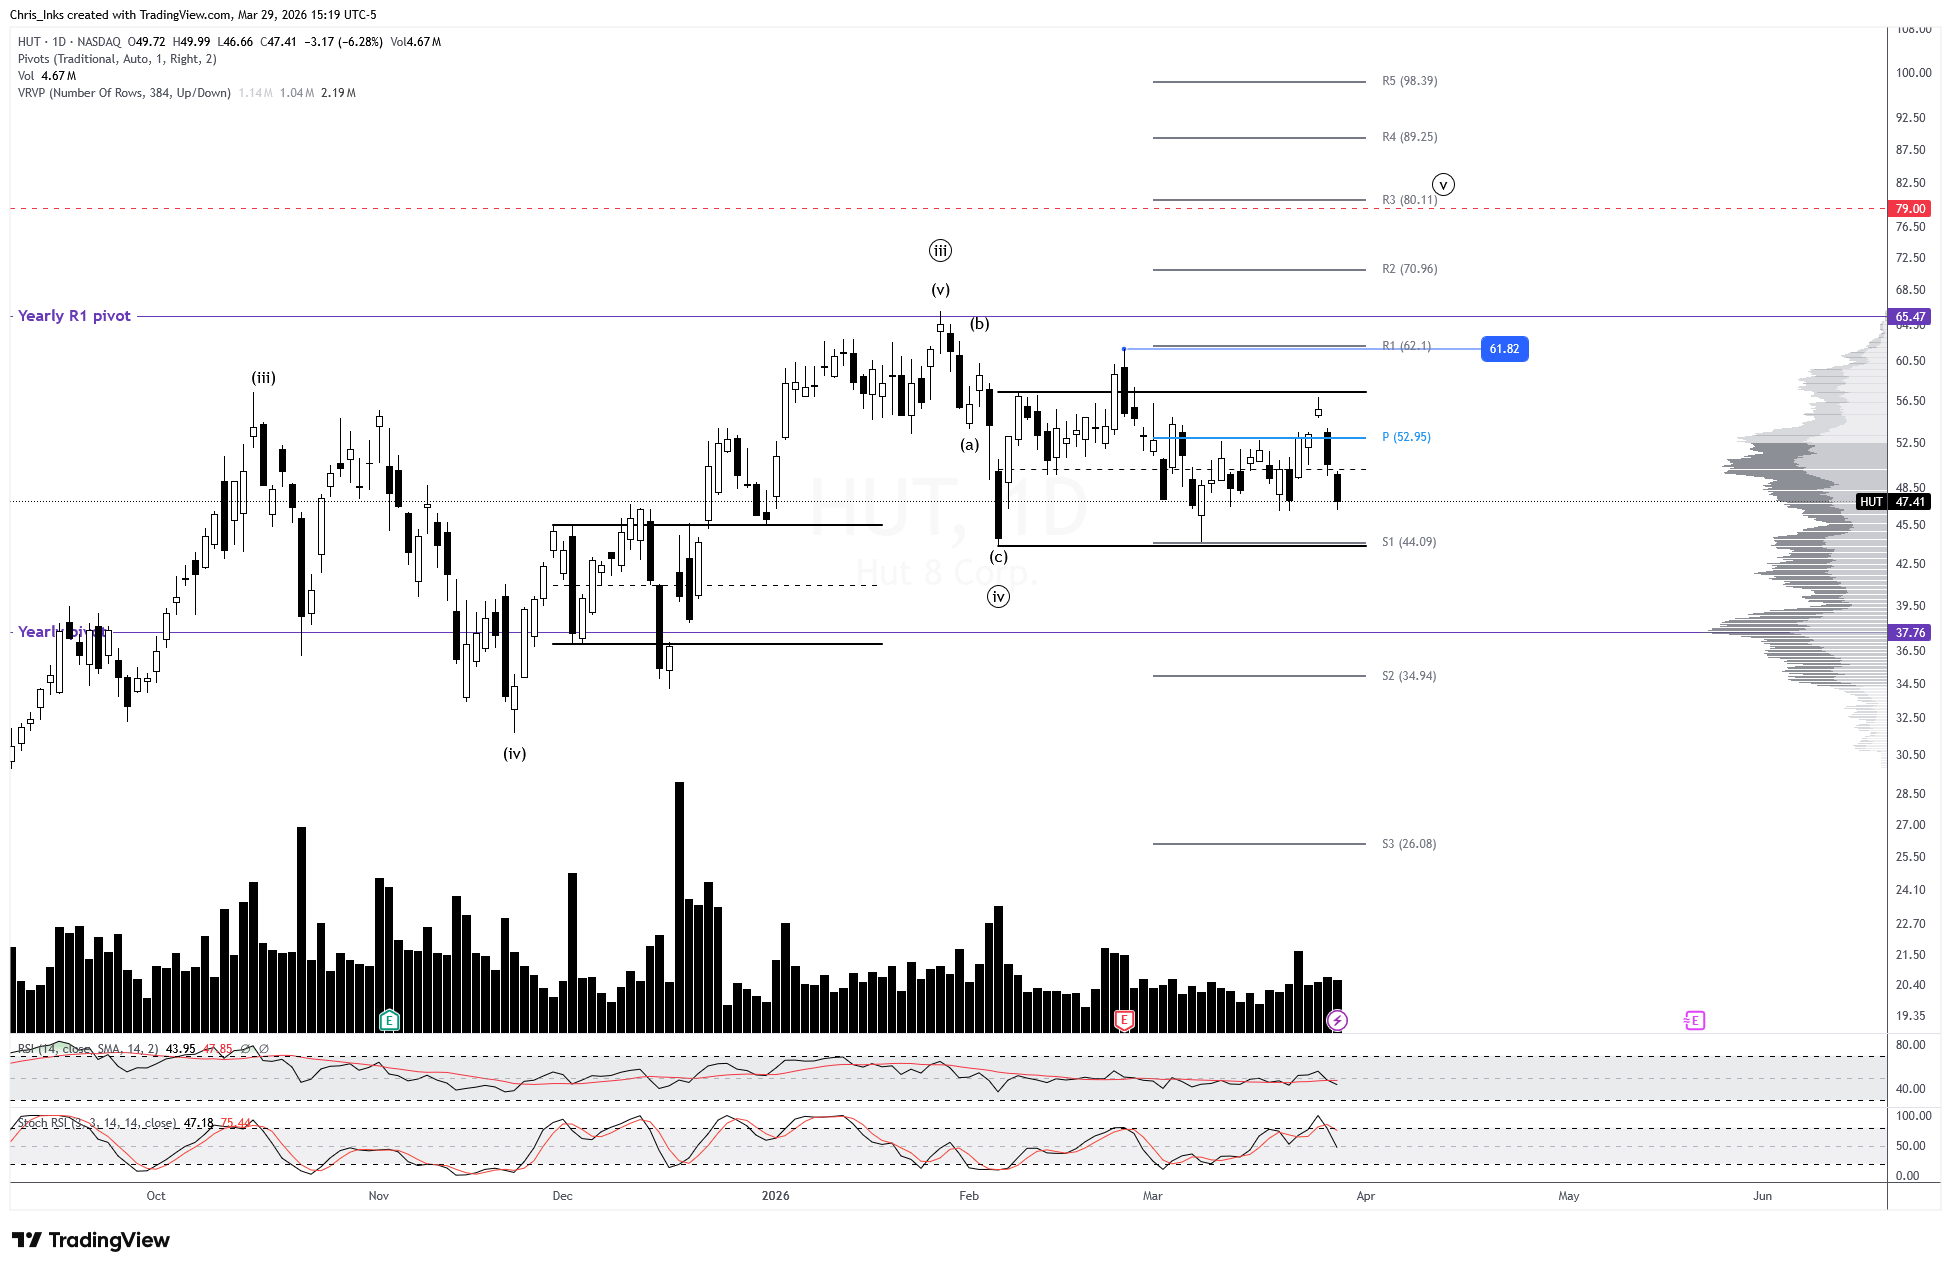
Price gapped up above the monthly pivot on Wednesday and then gapped back down below it on Thursday, continuing lower on Friday. The wave ((iv)) extreme is still holding as support for now. Continued decline has an initial target of a sweep of the wave ((iv)) low, keeping wave ((iv)) alive, and a secondary target of the yearly pivot at 37.76.
Breaking out above the 61.82 level will set up the pattern target of 79.
Wave ((v)) of 3 has a pattern target of 79. But wave 3 has a minimum expected target of 132.87. So, continued rally through 79 will suggest a possible overextension of wave ((v)) up toward that wave 3 target area.
*Target placement is not based on time. I only focus on the target levels.
6. Argo Blockchain ($ARBK)
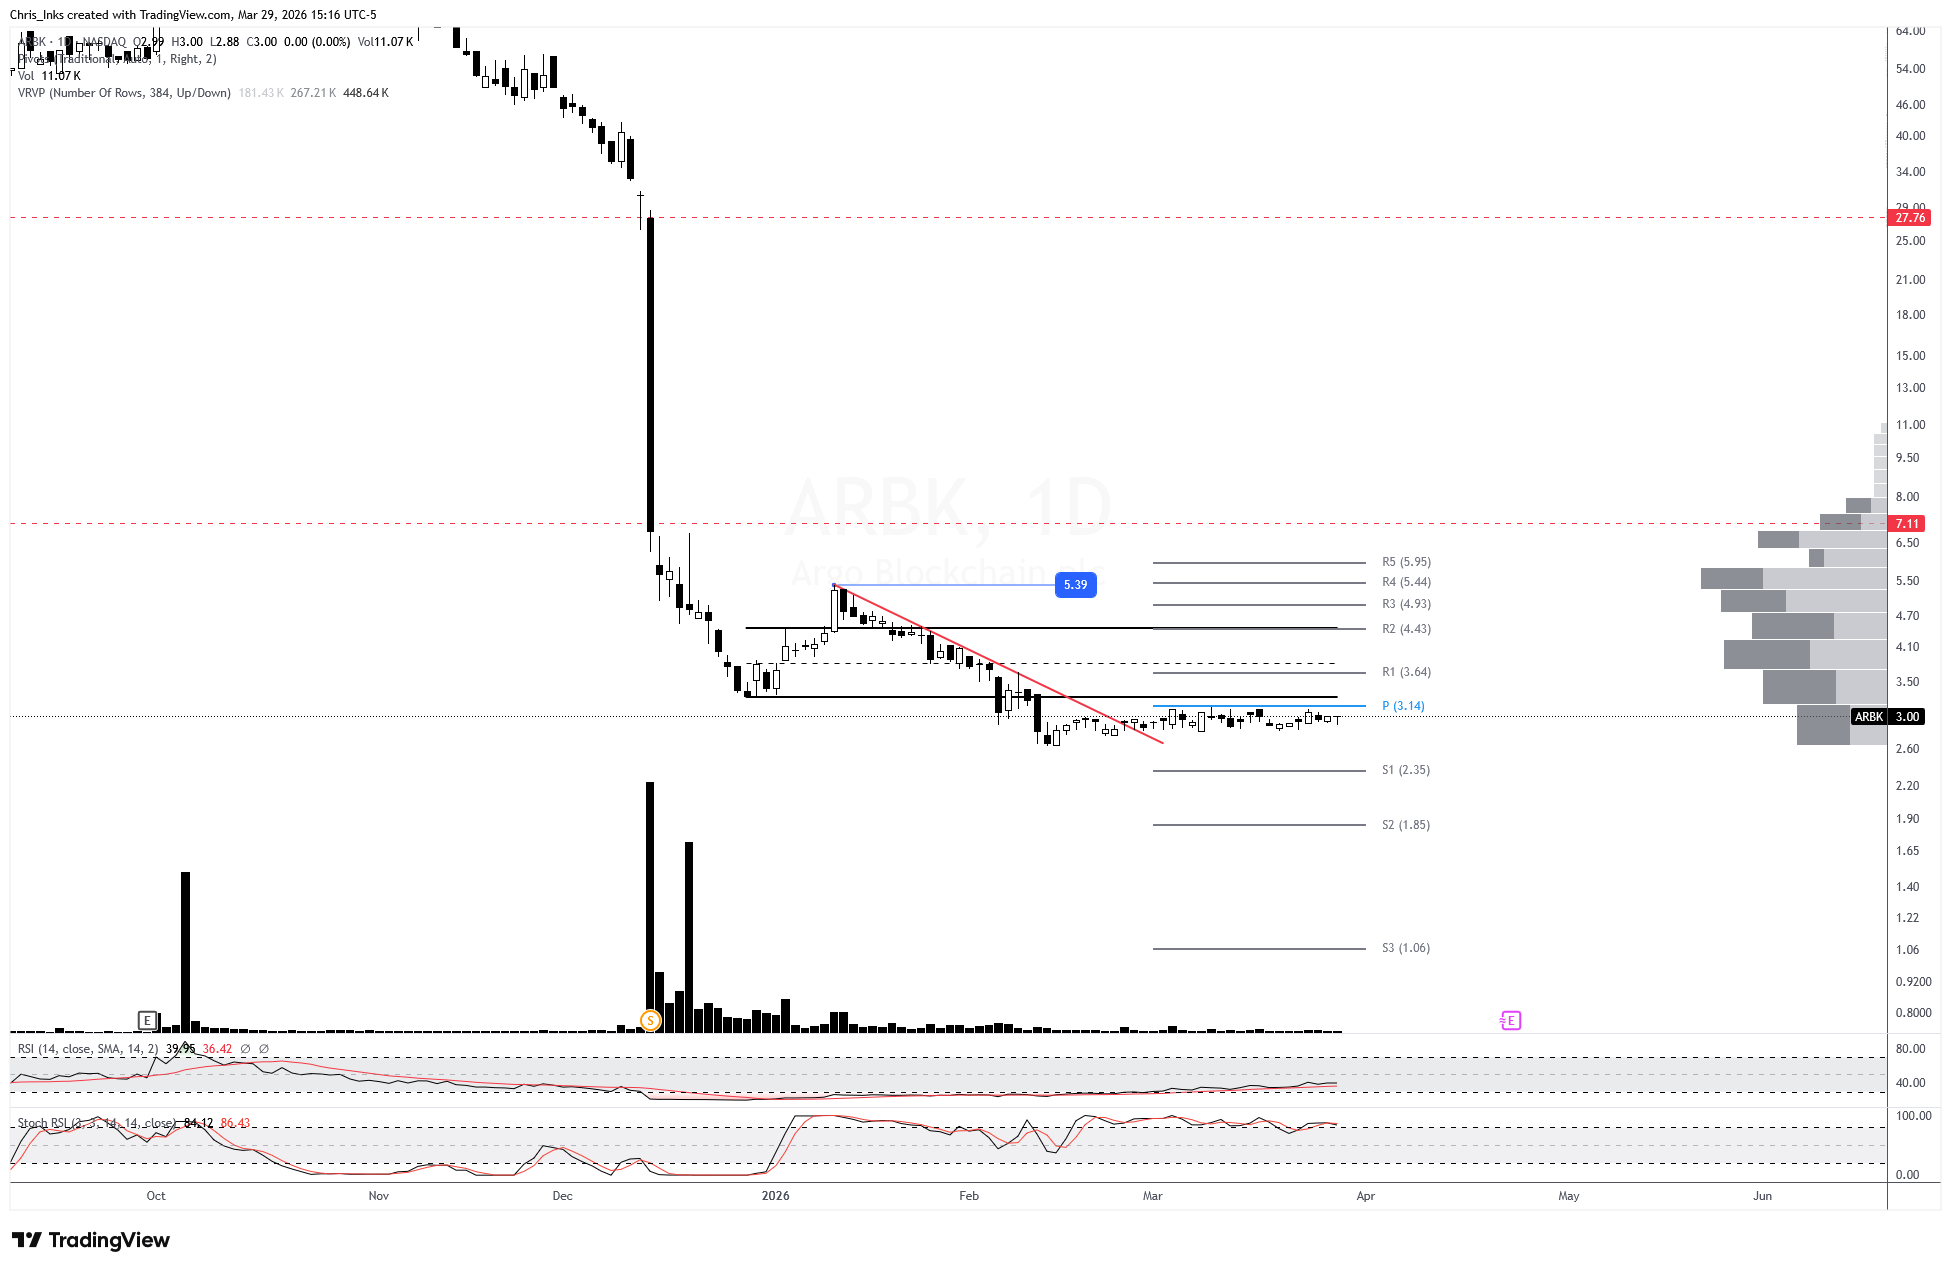
This one just keeps on printing sideways, just below the monthly pivot. There continues to be nothing to add to the analysis this week. A break out and close above the range resistance will suggest that the low may be in. Further break out above 5.39 will add some confidence to that scenario. Pushing into the large December 12th daily candle could see price rallying just as strongly back up through it toward 27 dollars. But, as usual, traders should be extremely cautious with this one.
Breaking down will give us an initial downside target of the monthly S1 pivot at 2.35.
*Target placement is not based on time. I only focus on the target levels.
Go from AI overwhelmed to AI savvy professional

AI will eliminate 300 million jobs in the next 5 years.
Yours doesn't have to be one of them.
Here's how to future-proof your career:
Join the Superhuman AI newsletter - read by 1M+ professionals
Learn AI skills in 3 mins a day
Become the AI expert on your team
7. Hive Digital Technologies ($HIVE)
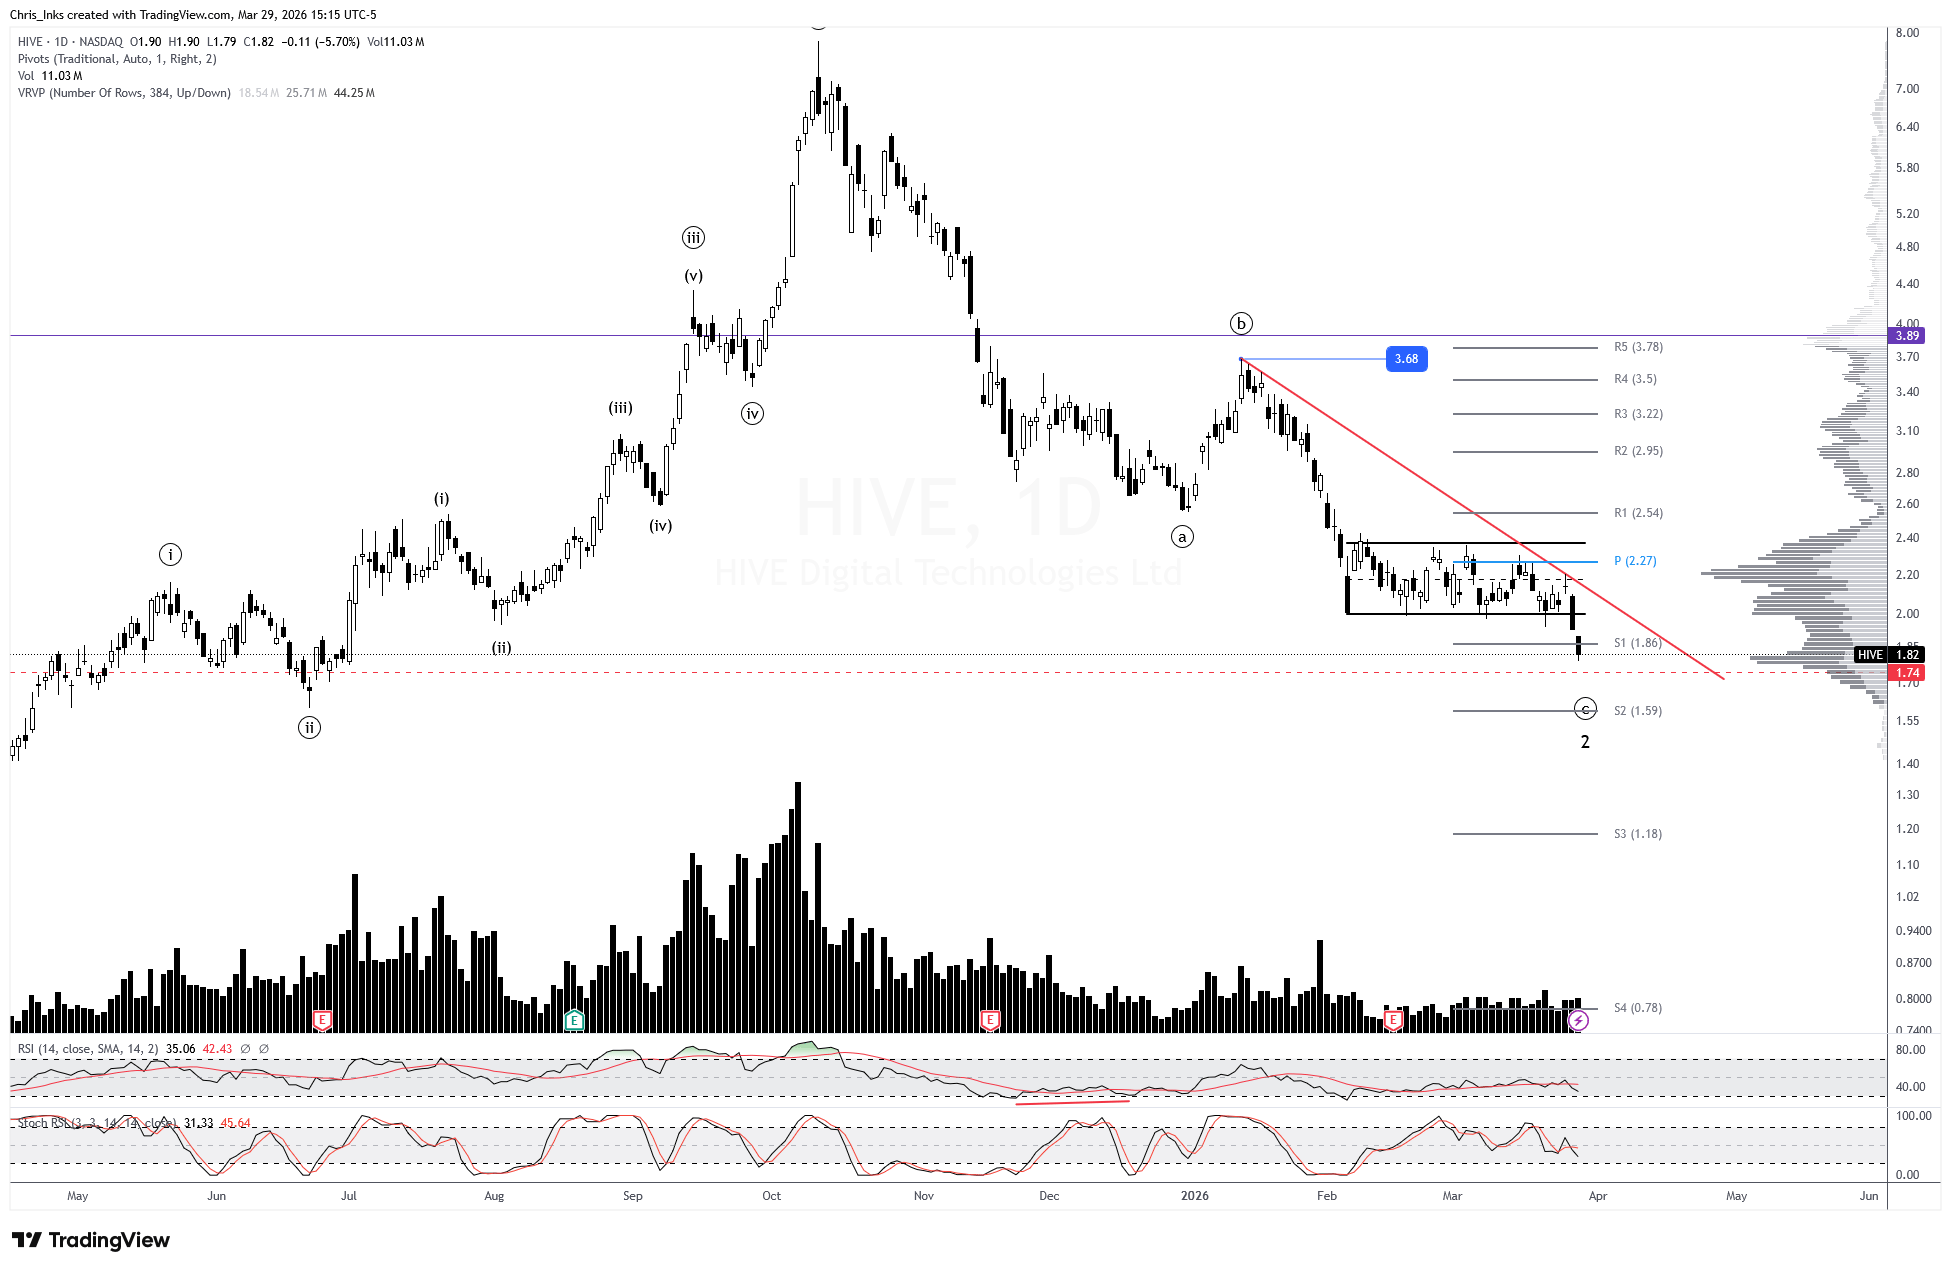
Price dropped further as expected and has almost reached the pattern target of ~1.74. Daily RSI and Stoch RSI have almost reset into oversold as well.
An impulsive daily candle break out and close above the descending red resistance will signal that the low may be in. Further break out above wave ((b)) resistance at 3.68 will add confidence to the count. Wave 3 has a minimum expected target of 15.00.
*Target placement is not based on time. I only focus on the target levels.
8. Terawulf Inc. ($WULF)
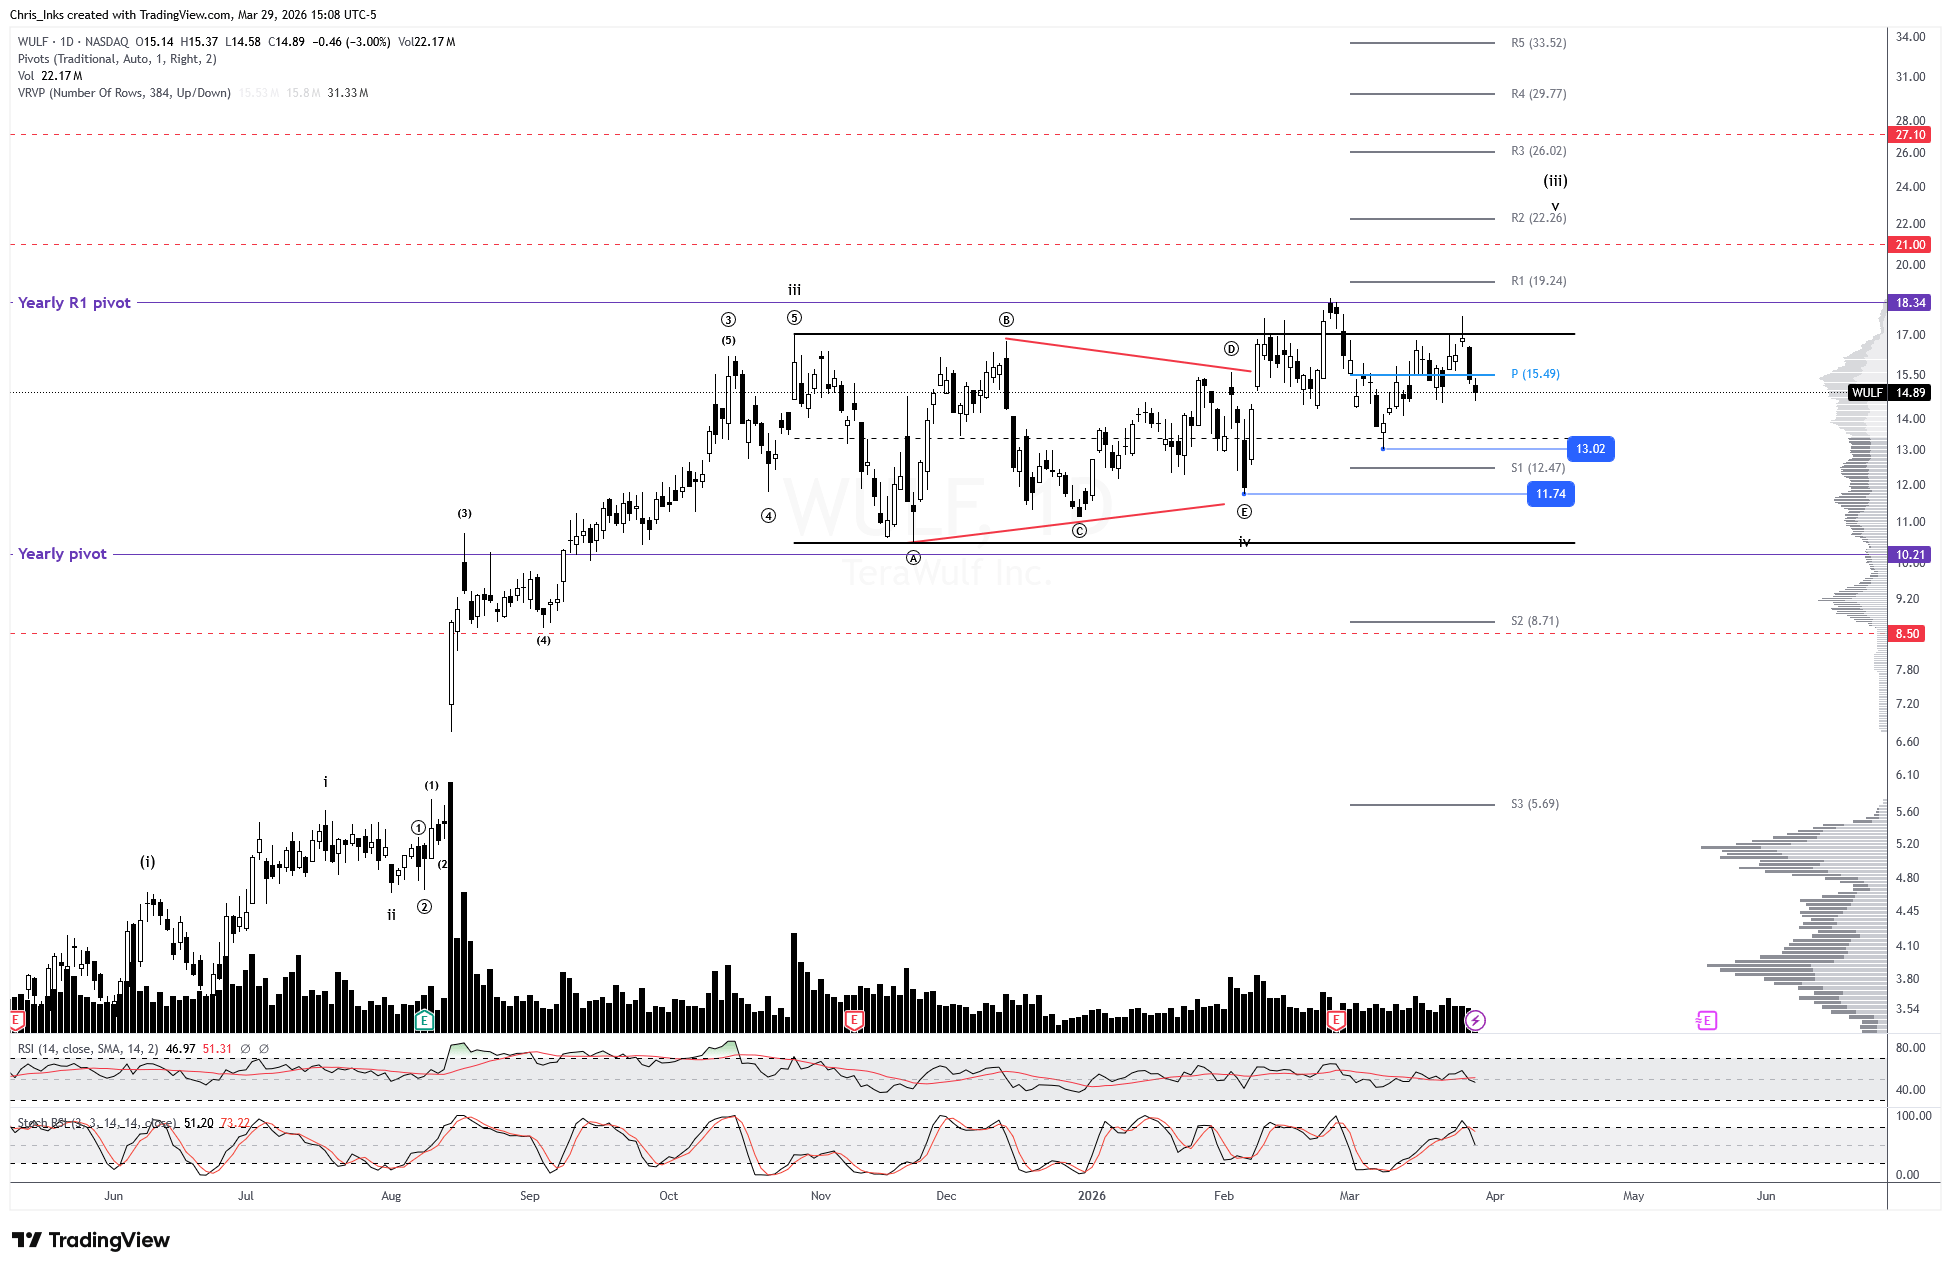
Price wicked out above the local swing high before dropping back down during the final two days of last week. Continued decline, below the local swing low at 13.02, has an initial downside target of the monthly S1 pivot at 12.47. Breaking down below wave iv triangle support at 11.74 will indicate that, either, price didn’t print a triangle and, instead, wave iv is still in progress and printing an expanded flat correction (which will have price at least sweeping the yearly pivot, or that wave v completed with the slight breakout above the wave iii extreme. The former is more likely that the latter at this time.
If wave iv triangle support holds, then wave v of (iii) has a pattern target of 21.00 based on the height of the triangle. It has a secondary target 27.10.
*Target placement is not based on time. I only focus on the target levels.
9. IRIS Energy Limited ($IREN)
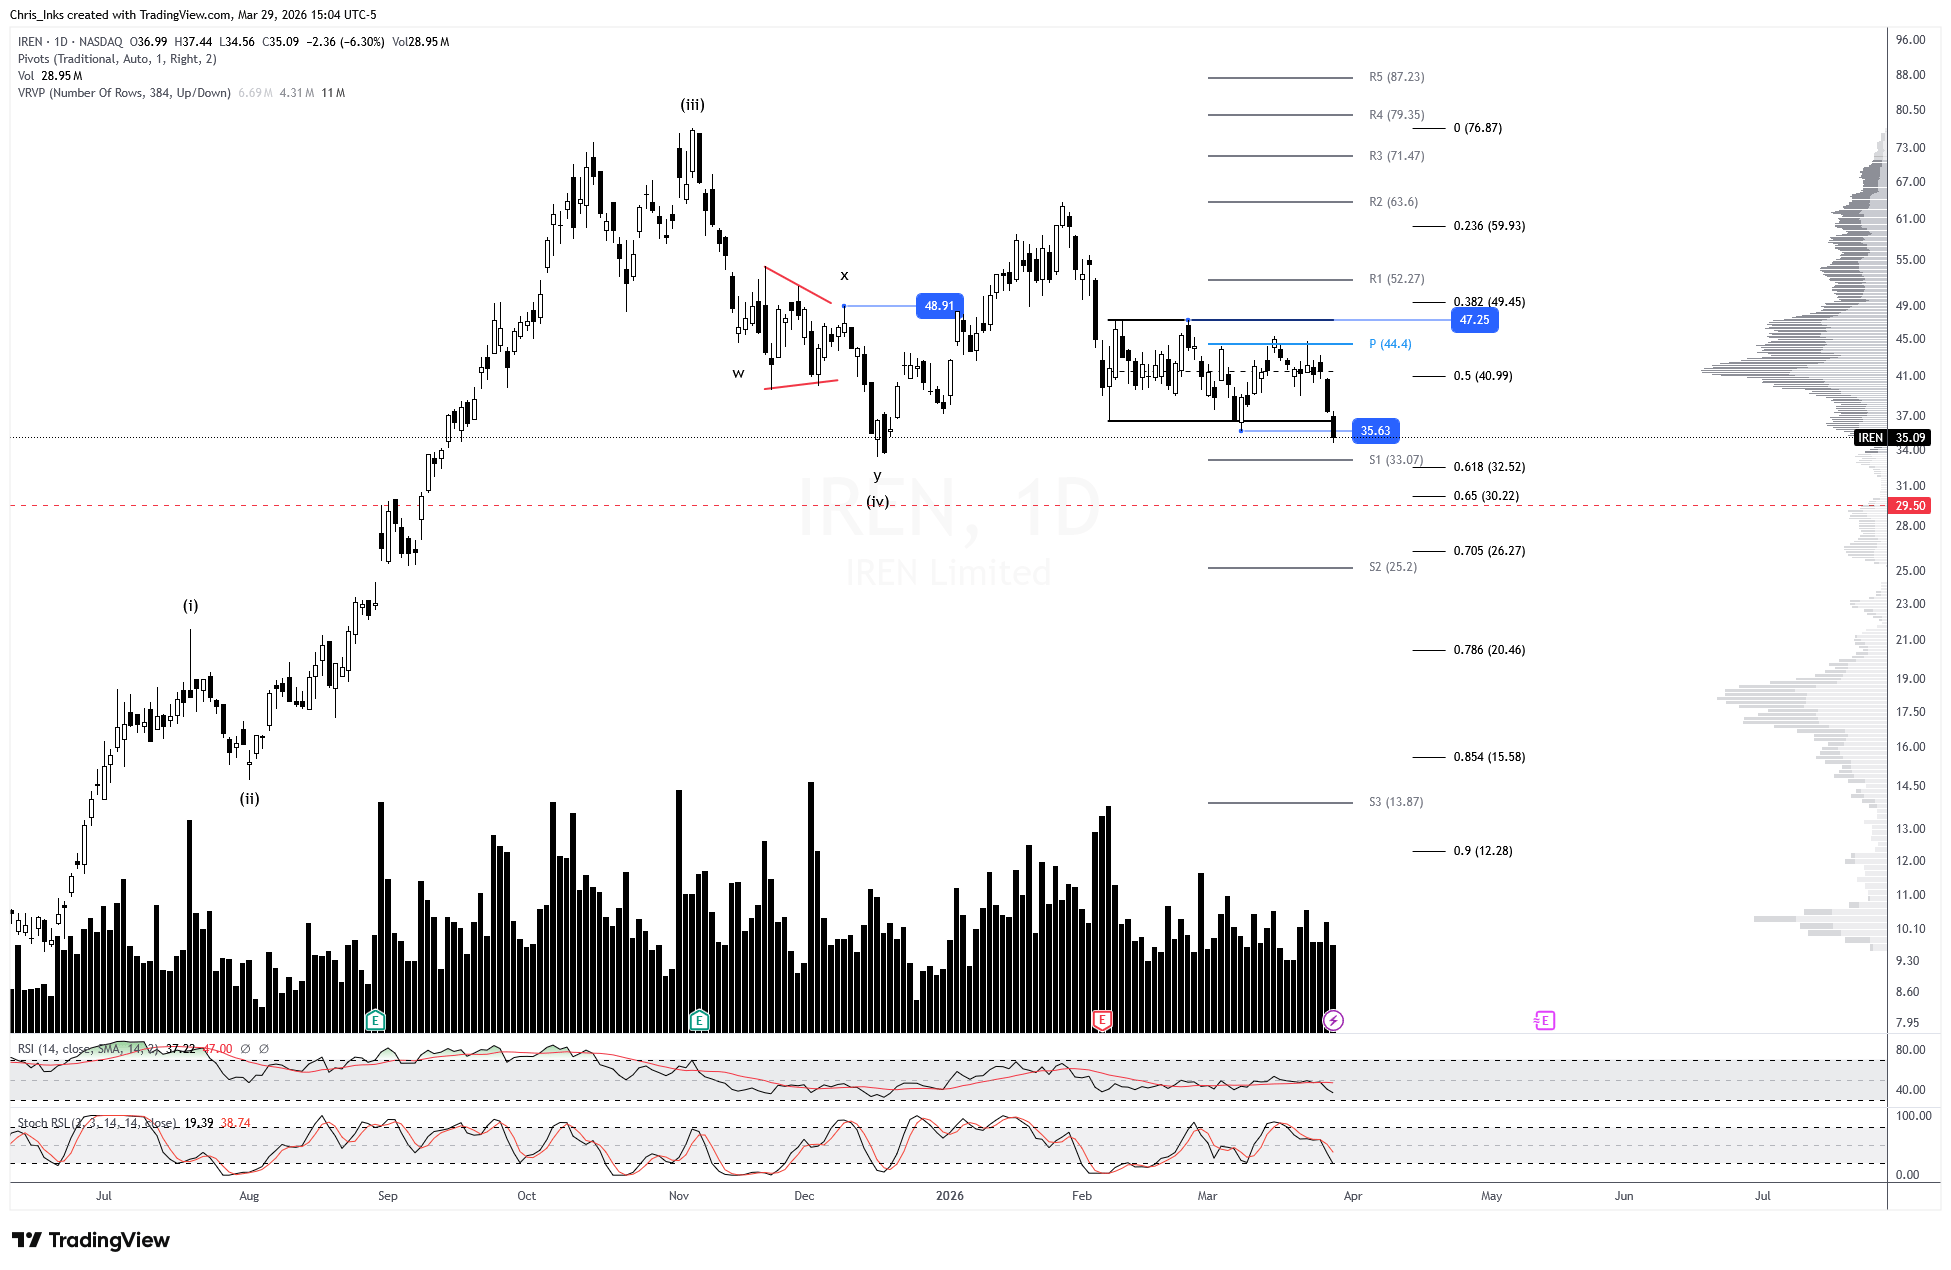
Price dipped just below the swing low at 35.63, so far. Continued decline this week will give us an initial downside target of the monthly S1 pivot at 33.07, keeping wave (iv) alive. That’s followed by a pattern target of 29.50, which would likely complete wave (iv) as a double zig zag (wxy) correction.
Breaking out above 47.25, while holding the wave (iv) swing low, will signal that the pullback is likely complete. Wave (v) has a pattern target of 104.50 and secondary target of 113.90.
*Target placement is not based on time. I only focus on the target levels.
10. Core Scientific, Inc. ($CORZ)
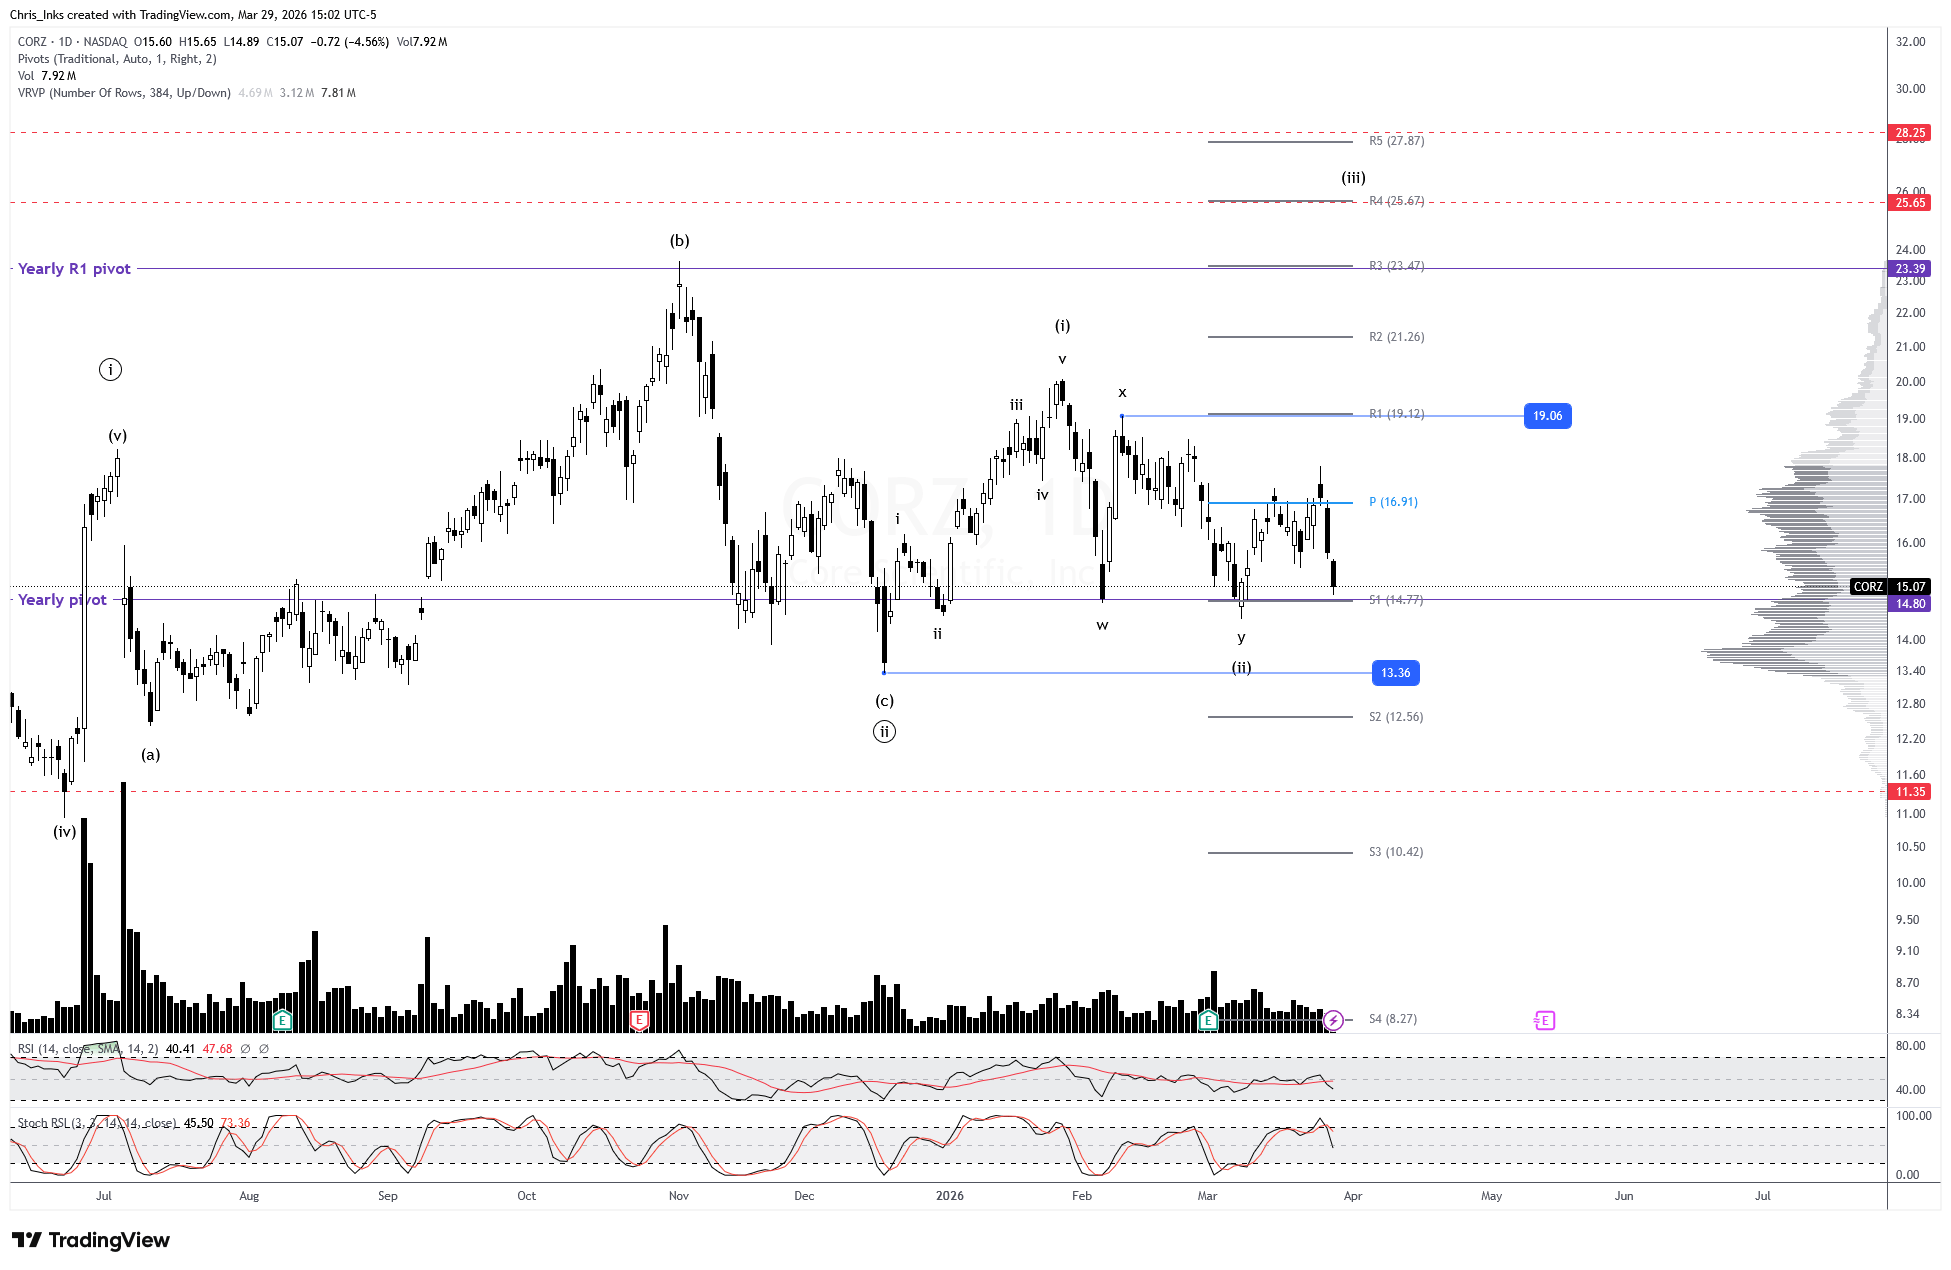
Price made a higher local high by Wednesday, but immediately dropped back down Thursday and Friday. That Friday low remained above the wave (ii) swing low however. Breaking down below the wave (ii) swing low will keep wave (ii) alive with an initial target of the wave ((ii)) swing low area around ~13.36. Breaking down below that level will invalidate waves (i) and (ii) while keeping wave ((ii)) alive with a possible target of ~11.35.
A breakout above wave x at 19.06 will add confidence to the count. Wave (iii) has a minimum expected target of 25.65 and secondary target of 28.25.
*Target placement is not based on time. I only focus on the target levels.
11. Cipher Mining Inc. ($CIFR)
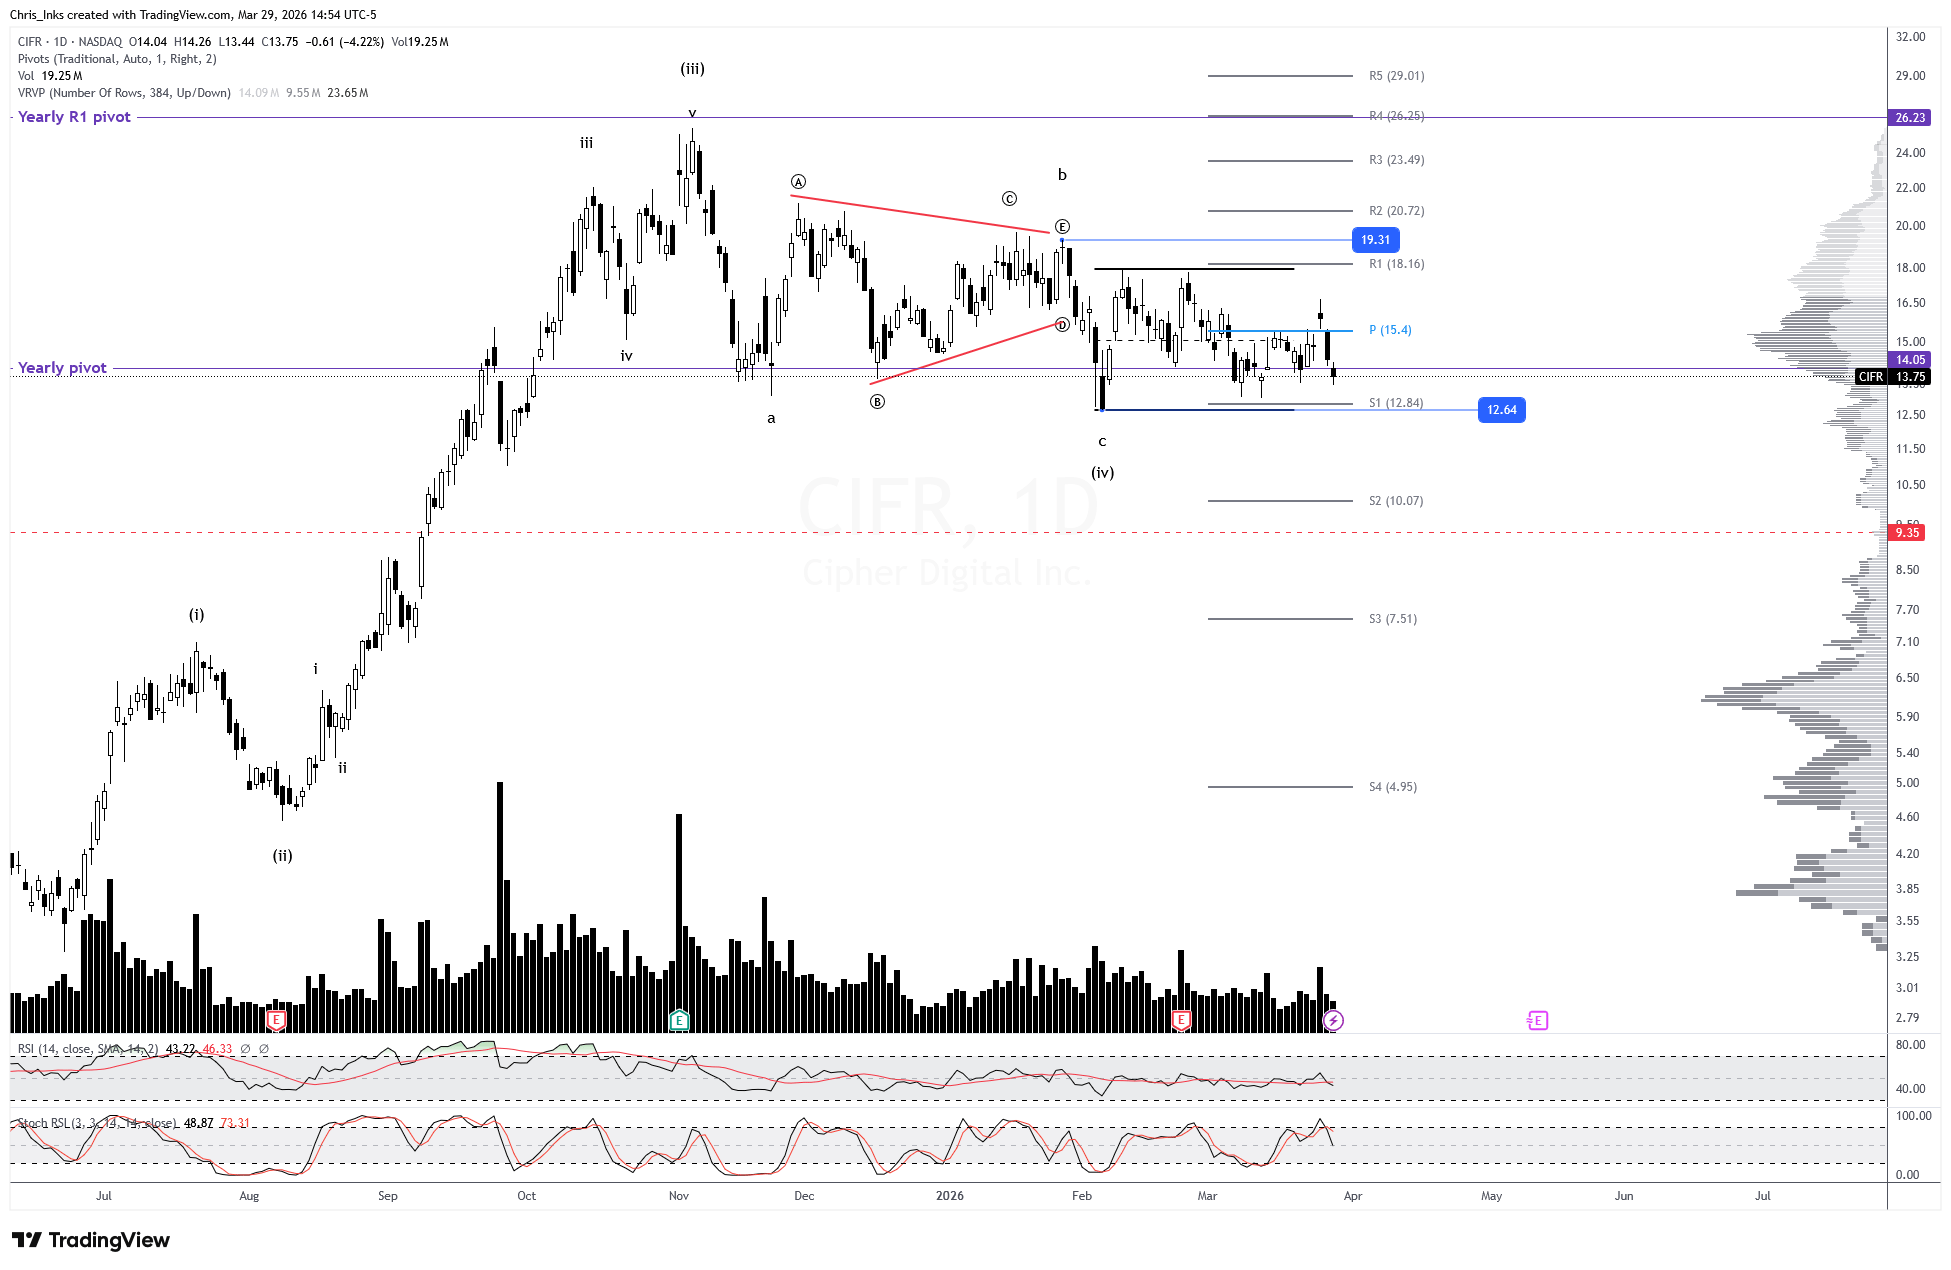
Price gapped up above the monthly pivot one day, and then gapped back down below it the next, and price closed below the yearly pivot the following day after that. Breaking down below wave (iv) at 12.64 will keep wave (iv) alive with a sweep of that low, or acceptance below it giving us a pattern target of 9.35.
A breakout above wave b triangle resistance at 19.31 will add confidence to the count. Wave (v) of ((iii)) has a pattern target of 33.50.
*Target placement is not based on time. I only focus on the target levels.
12. Bitdeer Technologies Group ($BTDR)
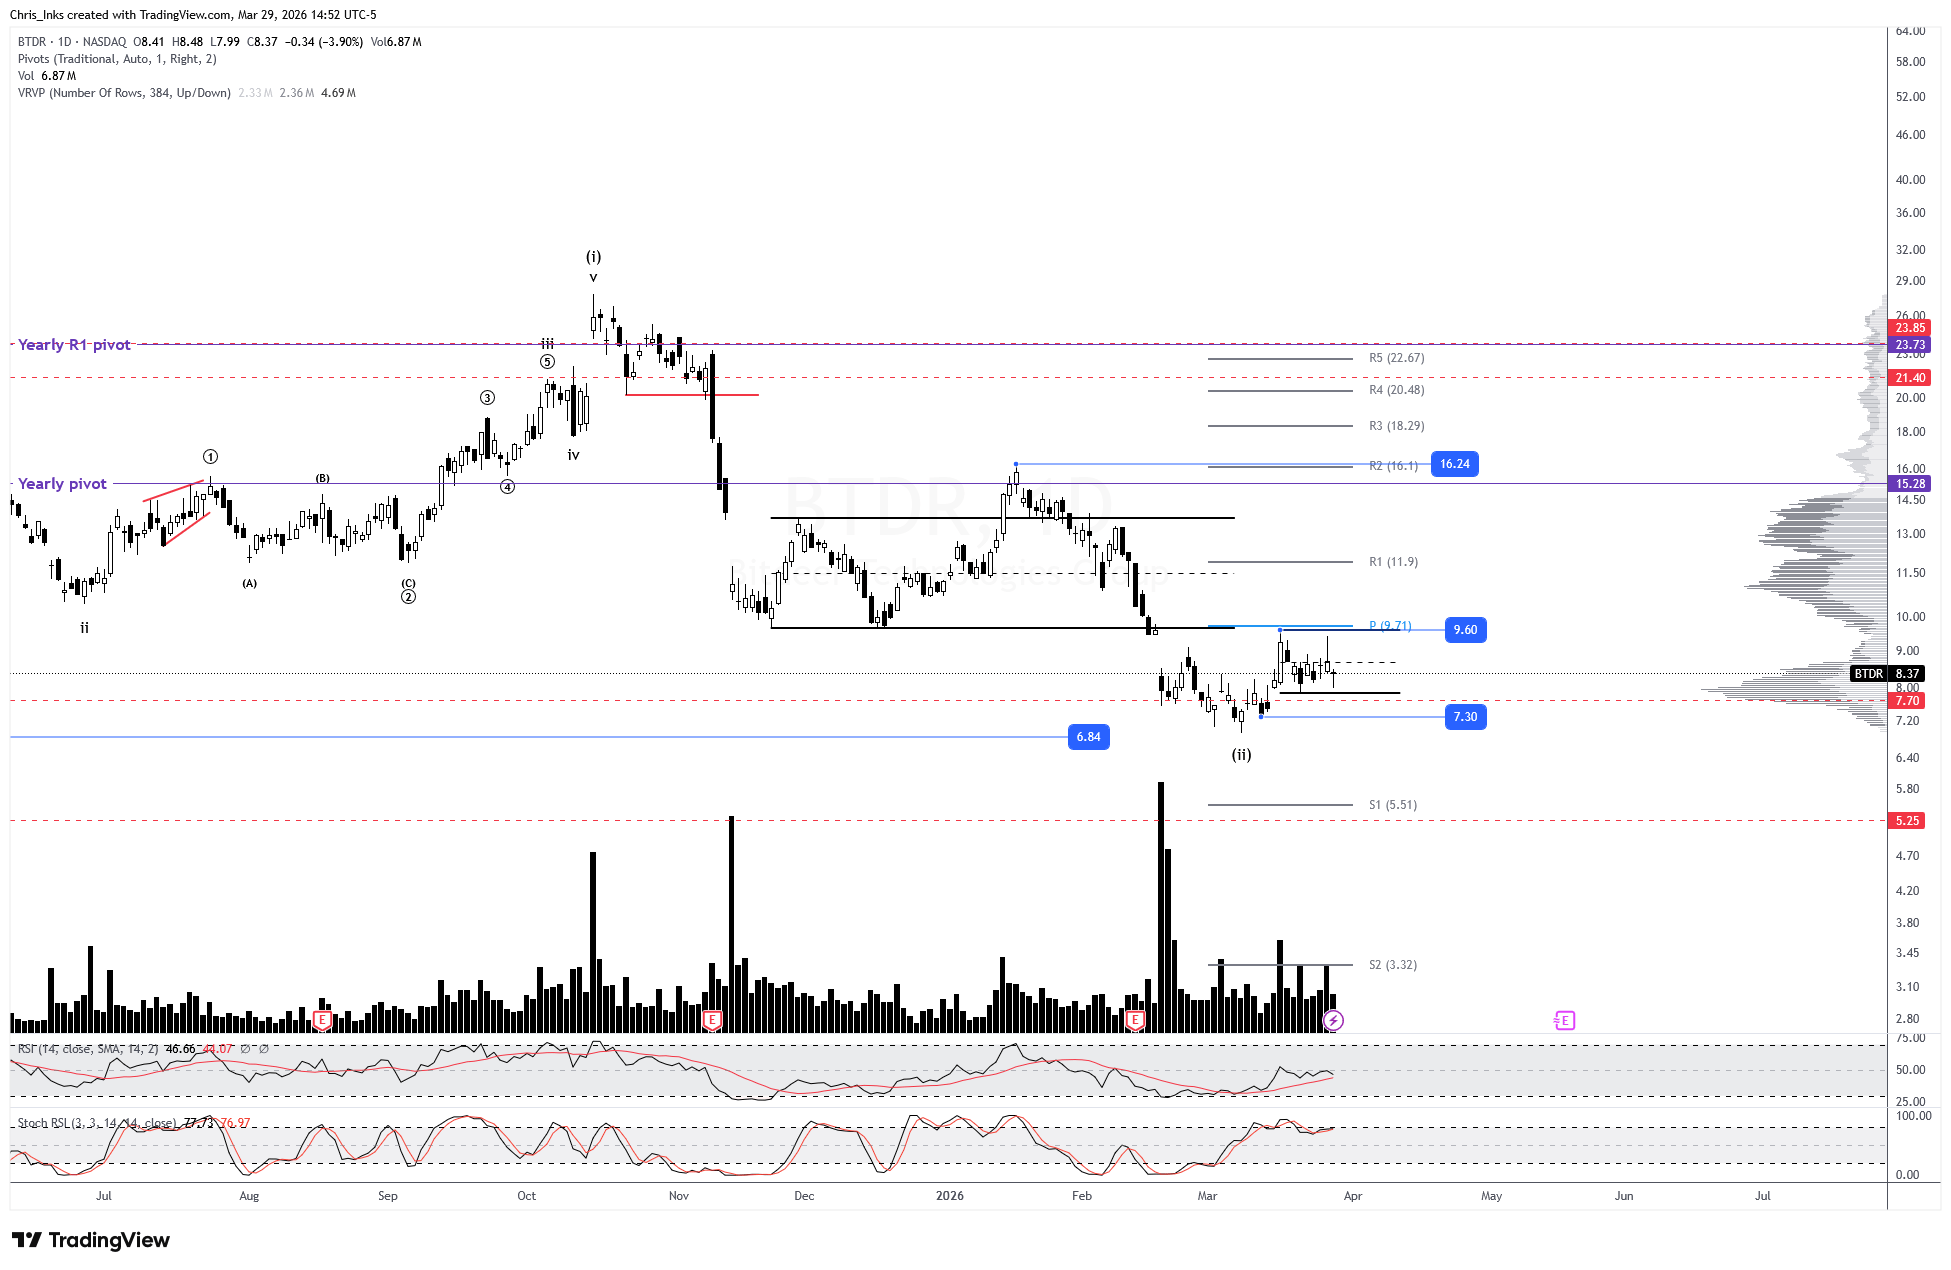
Price bounced almost into the monthly pivot once more before pulling back toward the local range low. The push higher off the wave (ii) extreme only appears to be in three waves right now, making it likely corrective. A breakdown below 7.30, without breaking out above the local range high at 9.60 first, will add confidence to the idea that it’s corrective, and we should then expect price to break down further. Breaking down below 6.84 will indicate that the overall structure into the October 15, 2025 swing high was likely wave (i) as a leading diagonal, rather than just the most recent rally off 6.84, and that will give us a pattern target of ~5.25.
An impulsive breakout and close above the monthly pivot at 9.71 will signal that the low is probably in. Further breakout above 16.24 will add confidence to the count, and signal that wave (iii) is likely in progress.
*Target placement is not based on time. I only focus on the target levels.
13. Mawson Infrastructure Group Inc. ($MIGI)
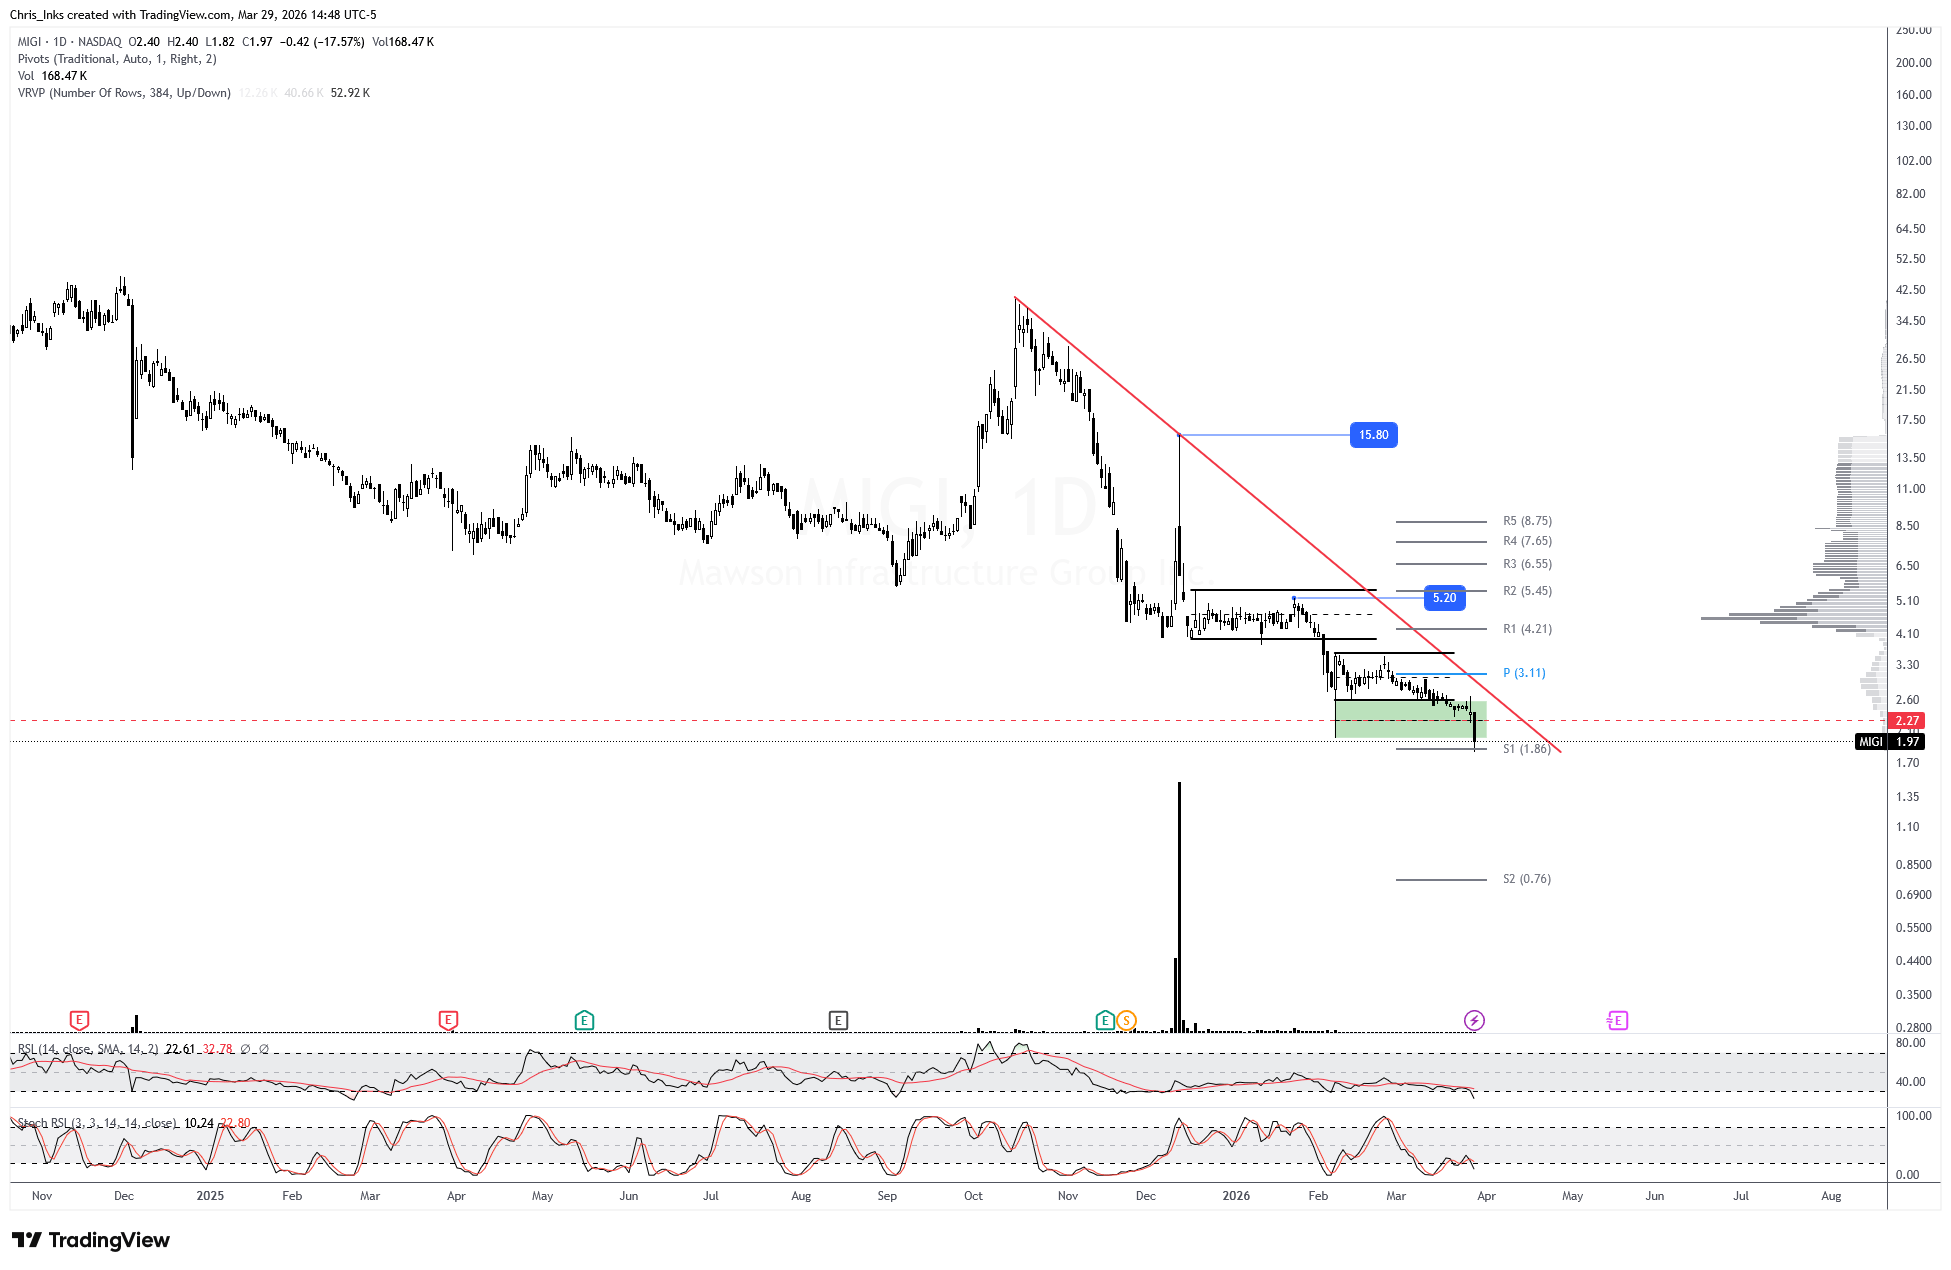
Price broke down below the swing low and hit the target of the monthly S1 pivot at ~1.86. It may be at, or near, completion of the pullback. An impulsive daily candle breakout and close above the descending red resistance will signal that the low is probably in. Further breakout above 5.20 will make it much more likely. But we need to see a breakout and close above the swing high at 15.80 to add real confidence to that idea.
*Target placement is not based on time. I only focus on the target levels.
14. Bit Digital Inc. ($BTBT)
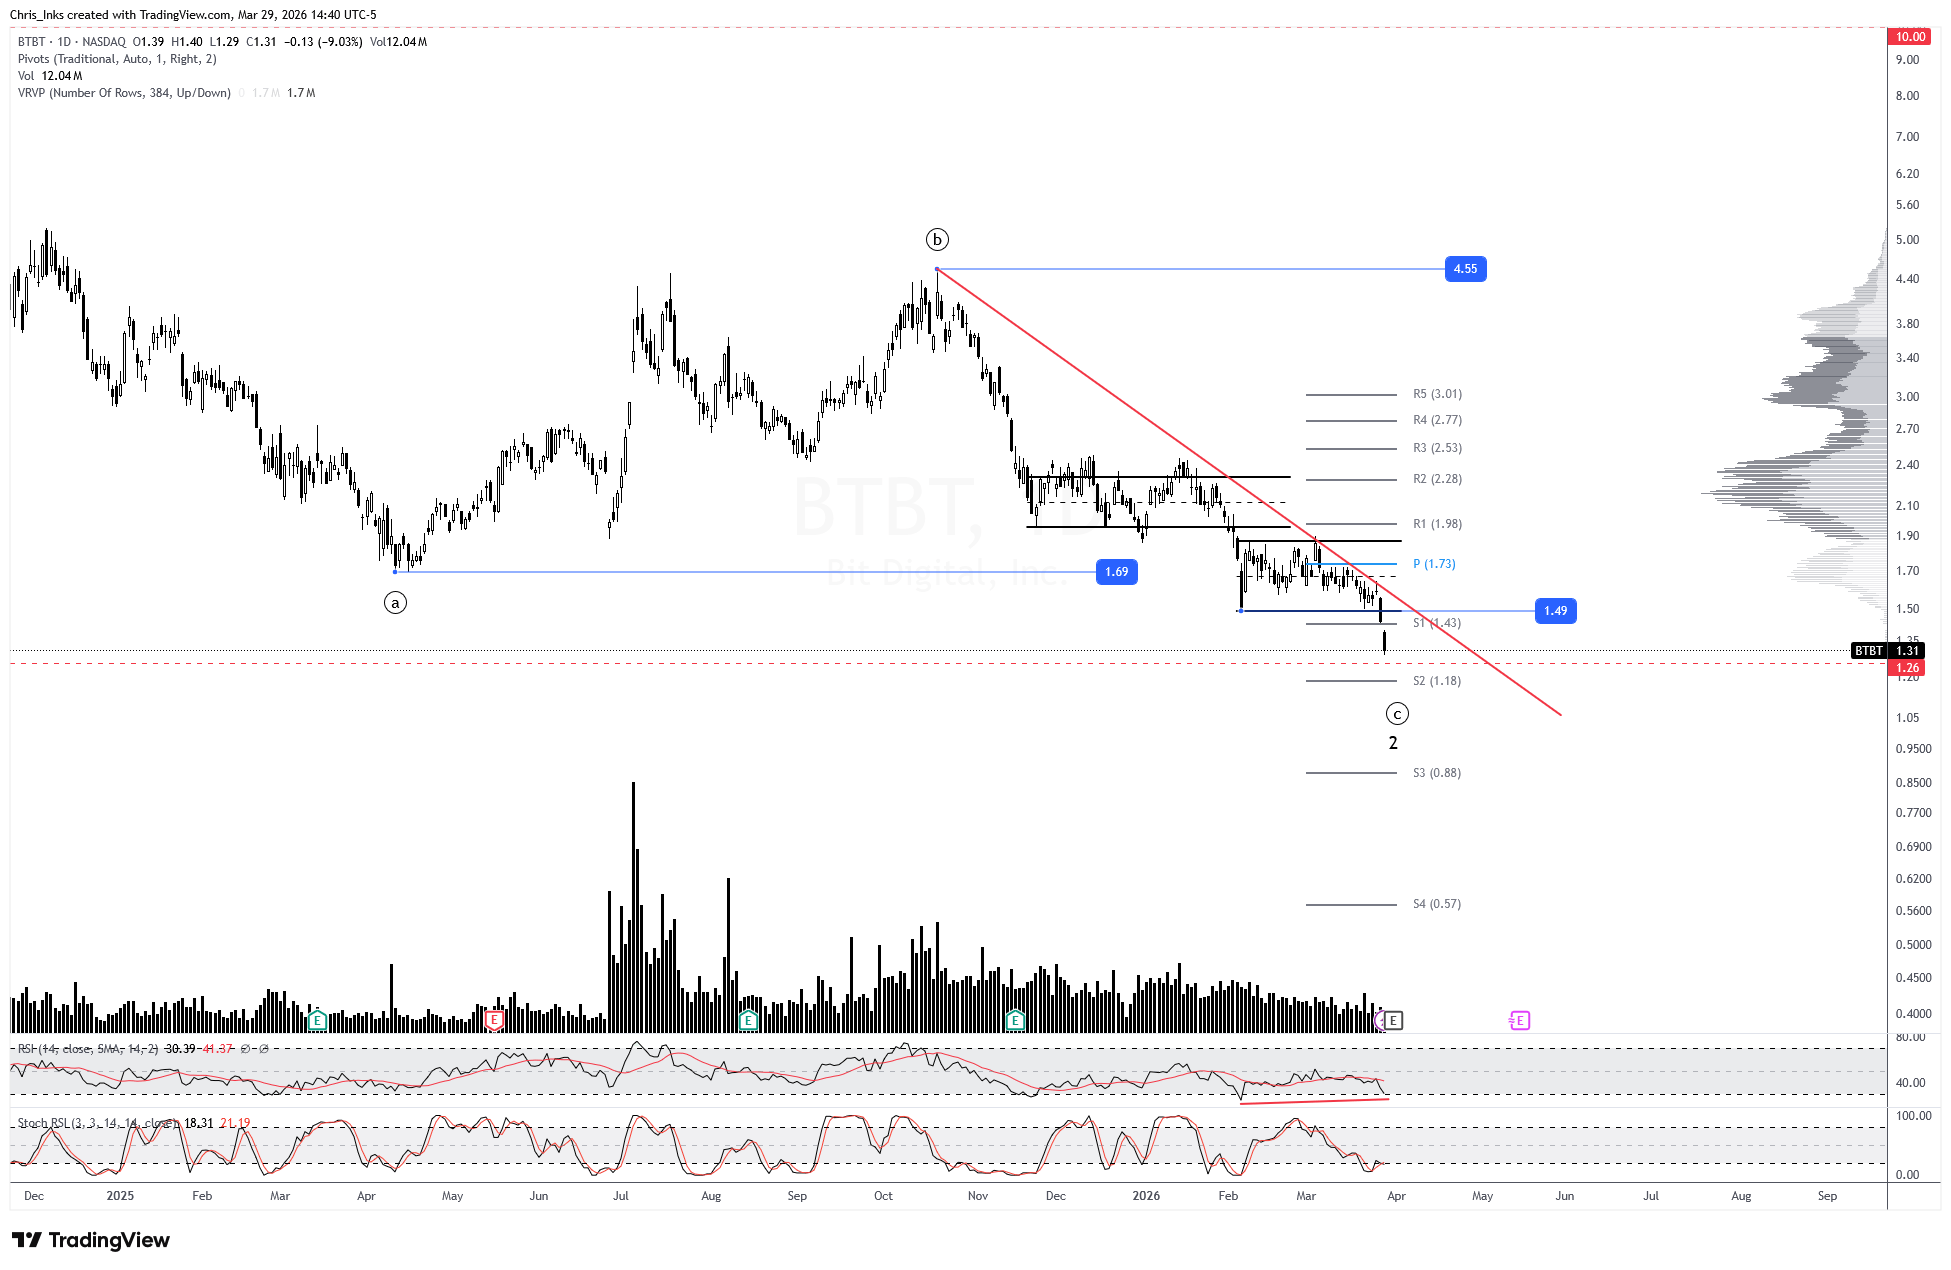
Price broke down pretty hard the final two days of last week, keeping wave 2 alive. It almost reached the downside pattern target of ~1.26, which is still the target if price continues lower. The RSI is printing bullish divergence just out of oversold at the moment and Stoch RSI is trying to stay out of oversold, which it just recently exited.
An impulsive daily candle breakout and close above the descending red resistance will signal that the low may be in. Further breakout above wave ((b)) resistance at 4.55 will add confidence to the count. Wave 3 has a minimum expected target of 10.00.
*Target placement is not based on time. I only focus on the target levels.
15. Greenidge Generation Holdings Inc. ($GREE)
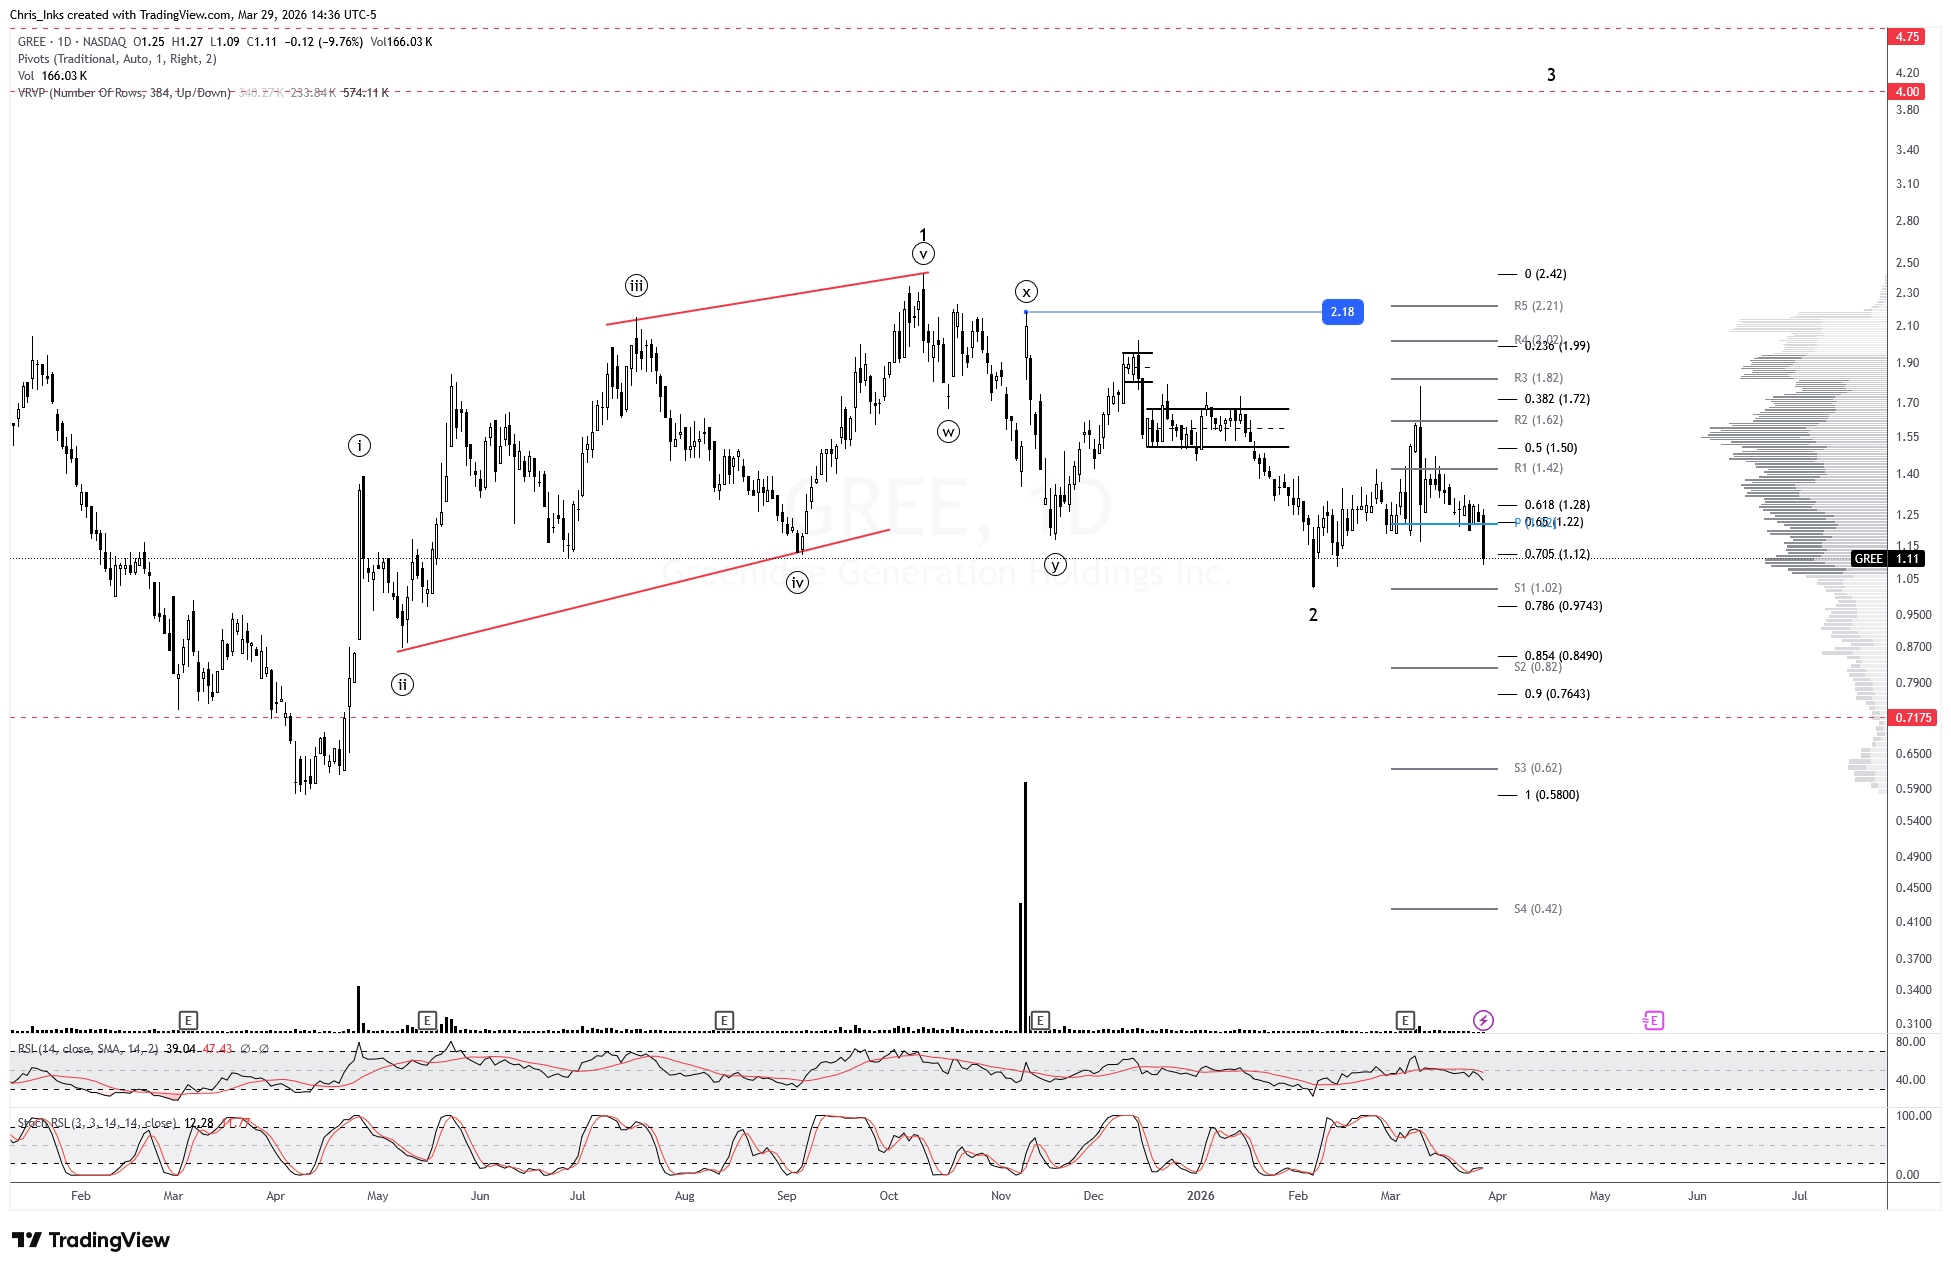
Price pulled back last week, but remains comfortably above the wave 2 extreme. Further break out above wave ((x)) resistance at 2.18 will add confidence to the count. Wave 3 has a minimum expected target of 4.00 and secondary target of 4.75.
Breaking down with price acceptance below wave 2, however, will keep wave 2 alive with a pattern target of 0.7175.
*Target placement is not based on time. I only focus on the target levels.
16. Ebang International Holdings Inc. ($EBON)
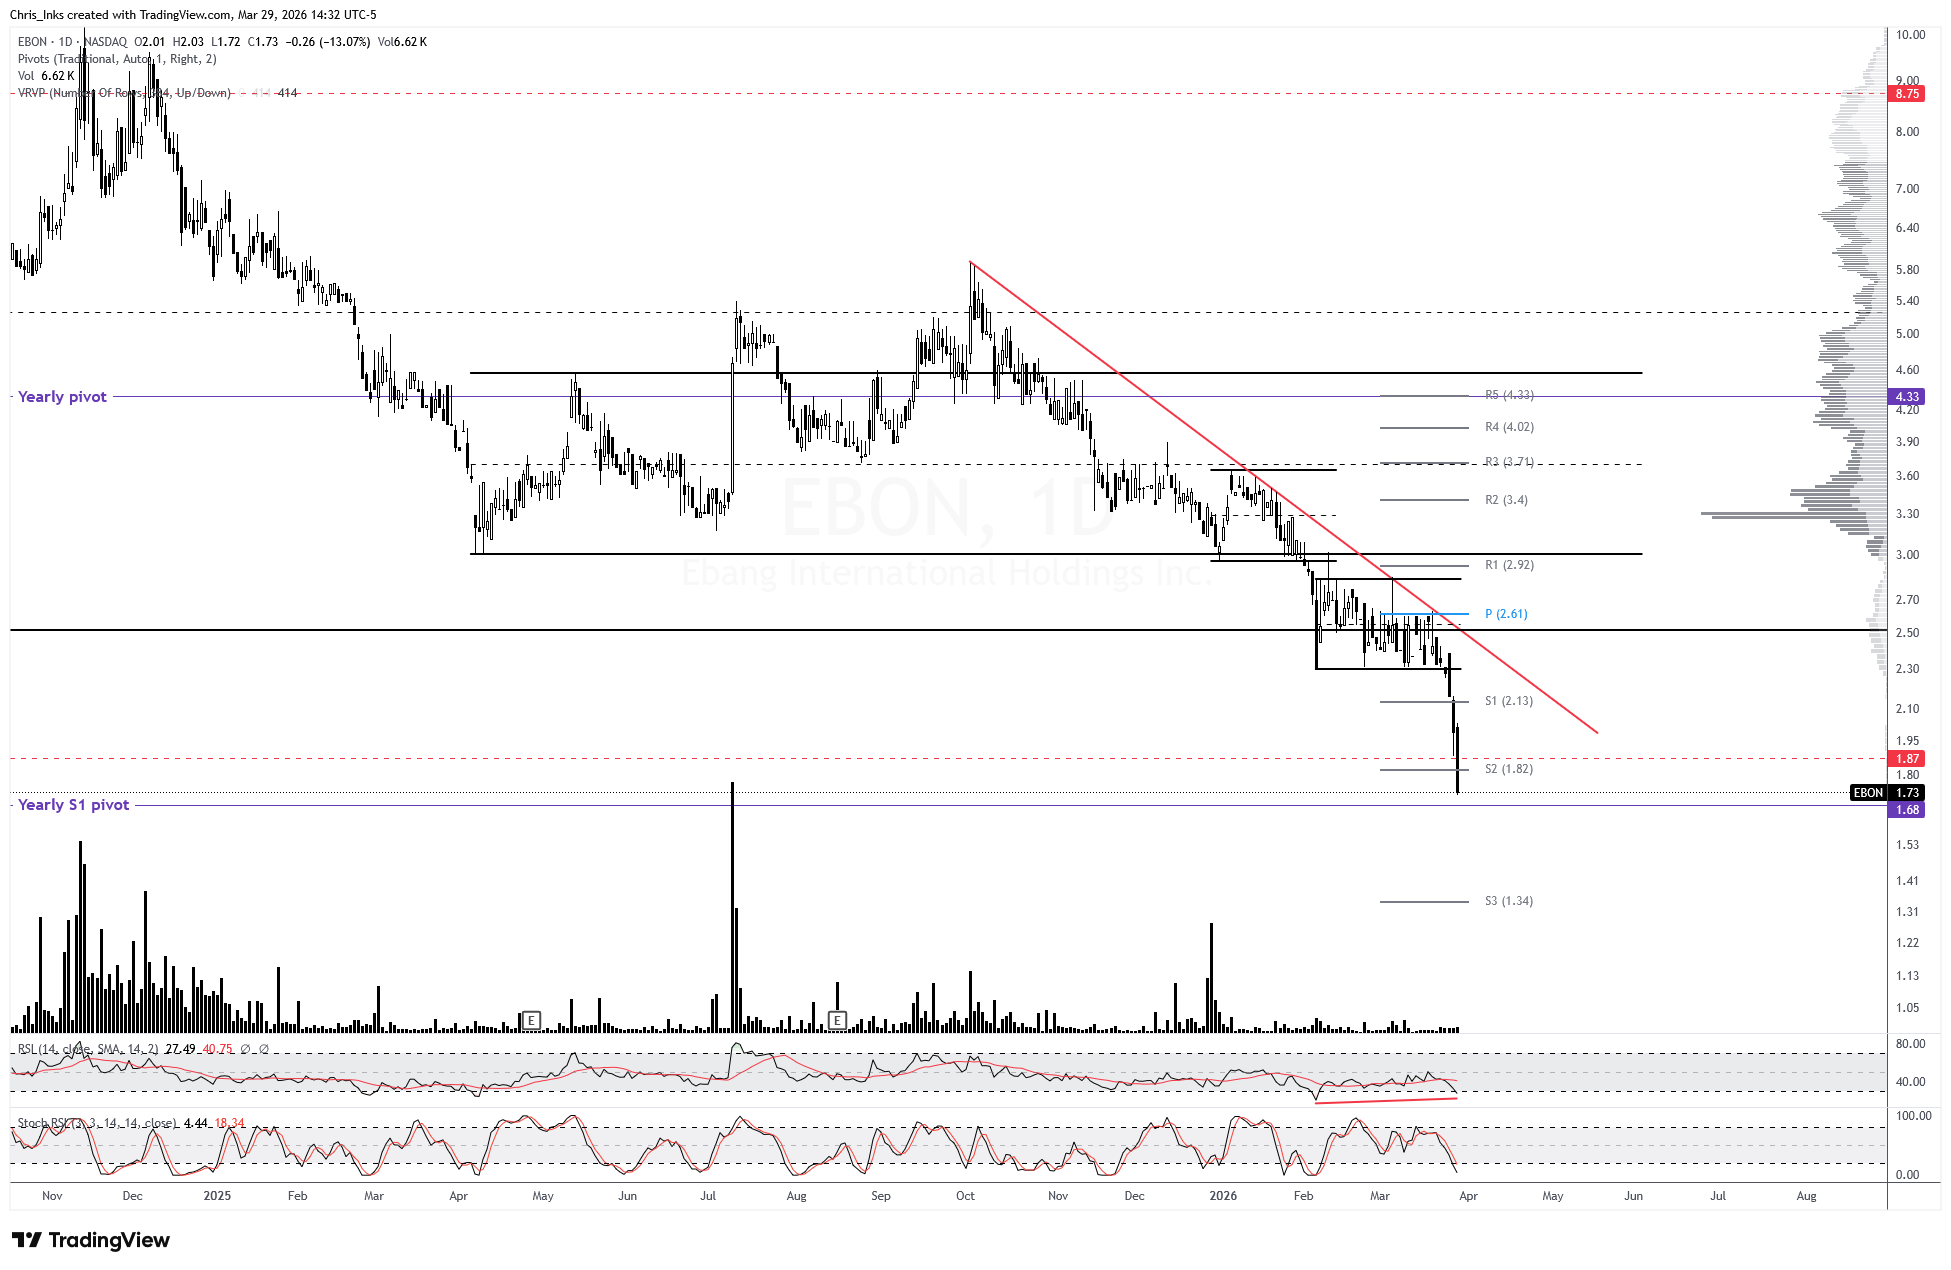
Price continued to decline, dropping near the lower target area. But in doing so, it’s now printing bullish RSI divergence in oversold with Stoch RSI also resetting in oversold. So, it’s looking like the decline may be over or nearly so. Further decline could see price targeting the nearly yearly S1 pivot area around ~1.68.
An impulsive daily candle break out and close above the descending red resistance will signal that the low may be in. That will give us a target of the yearly pivot at ~4.33.
*Target placement is not based on time. I only focus on the target levels.
17. Digi Power X ($DGXX)
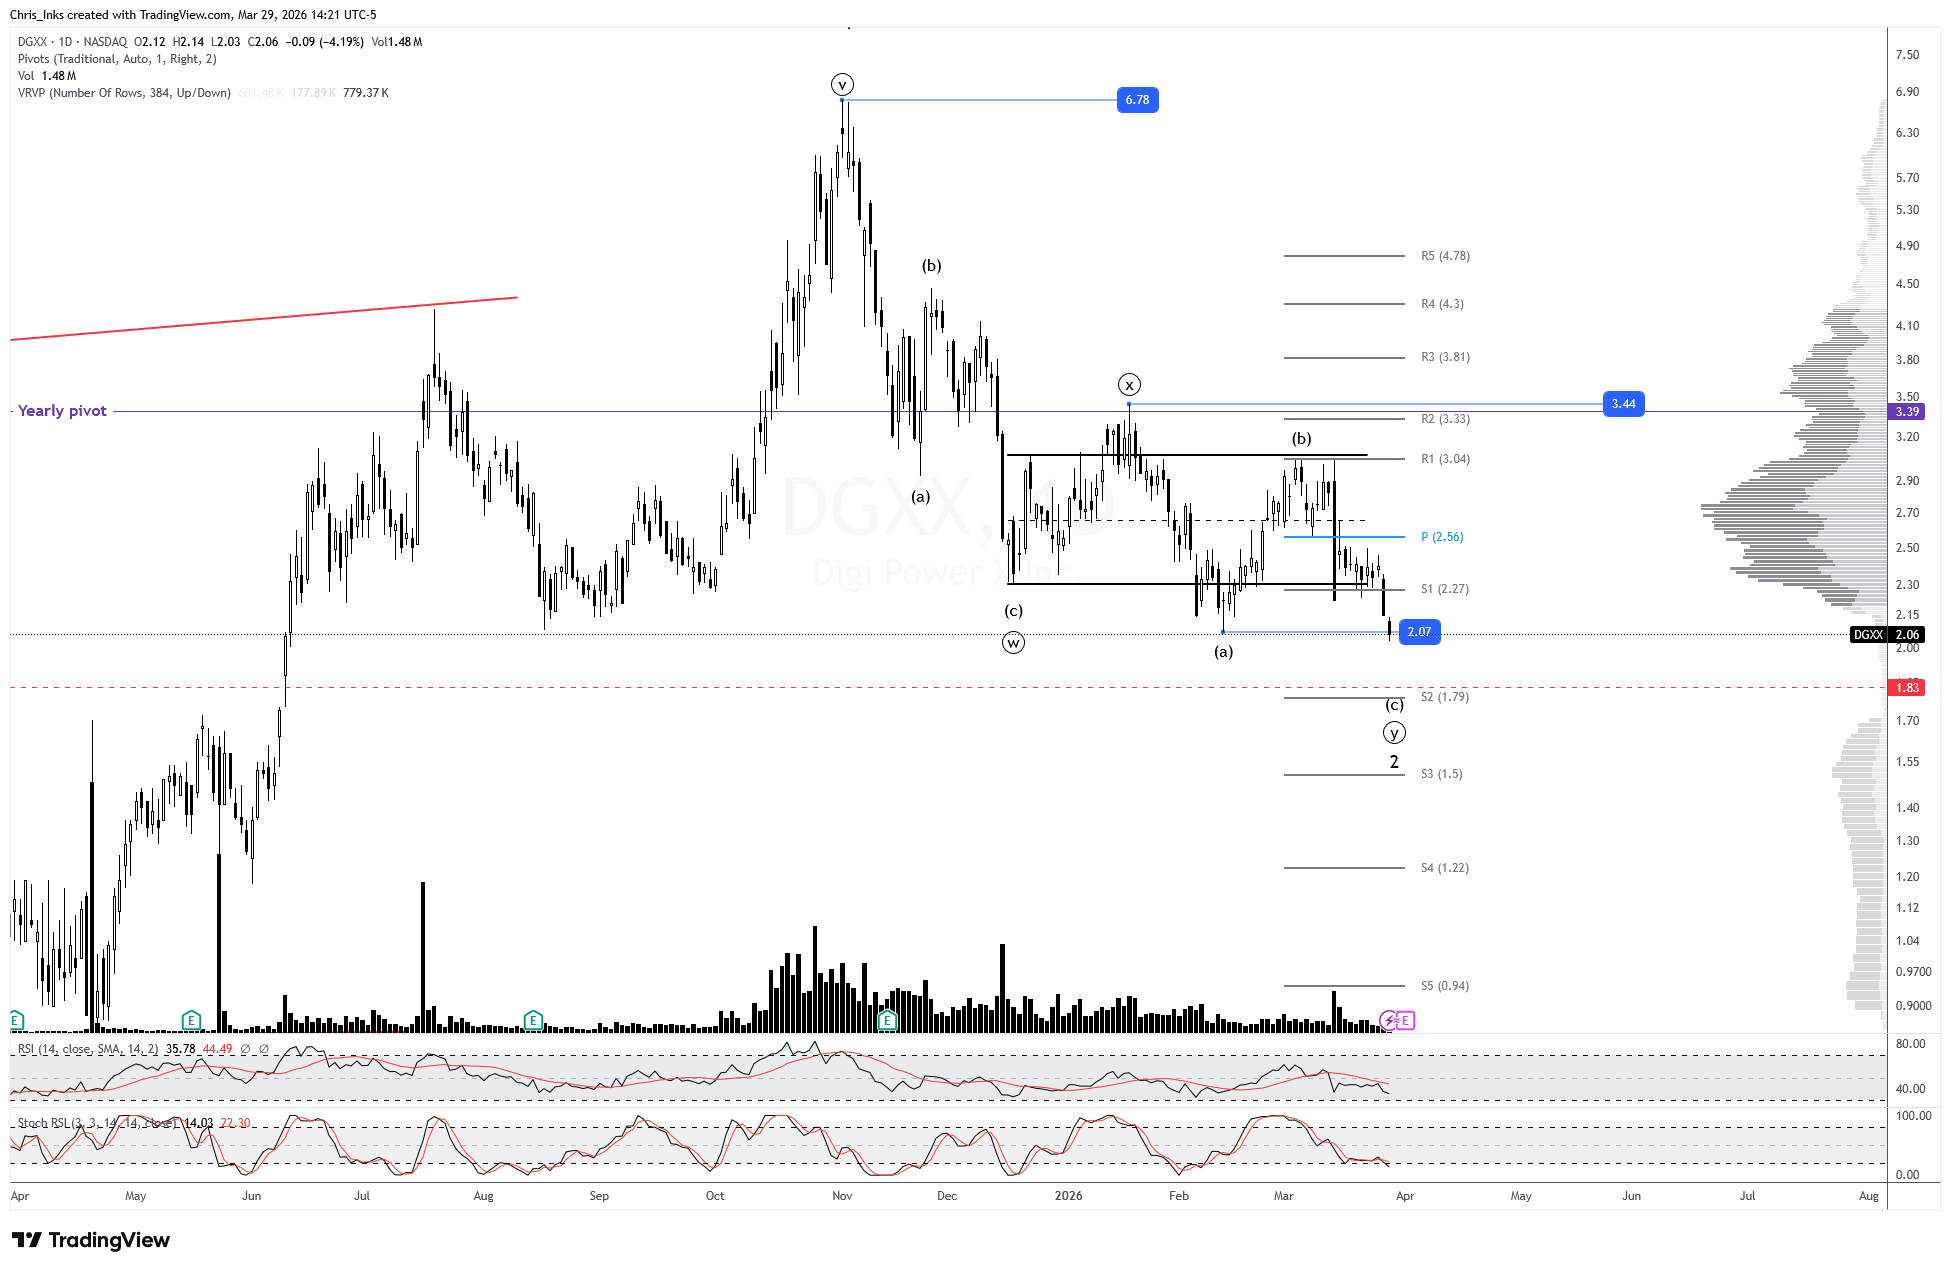
Price has swept the wave 2 swing low, keeping wave 2 alive. I have updated the count to indicate that wave ((y)) may be nearing completion with further decline having a target of ~1.83..
A breakout above the wave ((x)) extreme at 3.44 will add confidence to the count. Wave 3 has a minimum expected target of 12.60 and secondary target of 15.00.
*Target placement is not based on time. I only focus on the target levels.
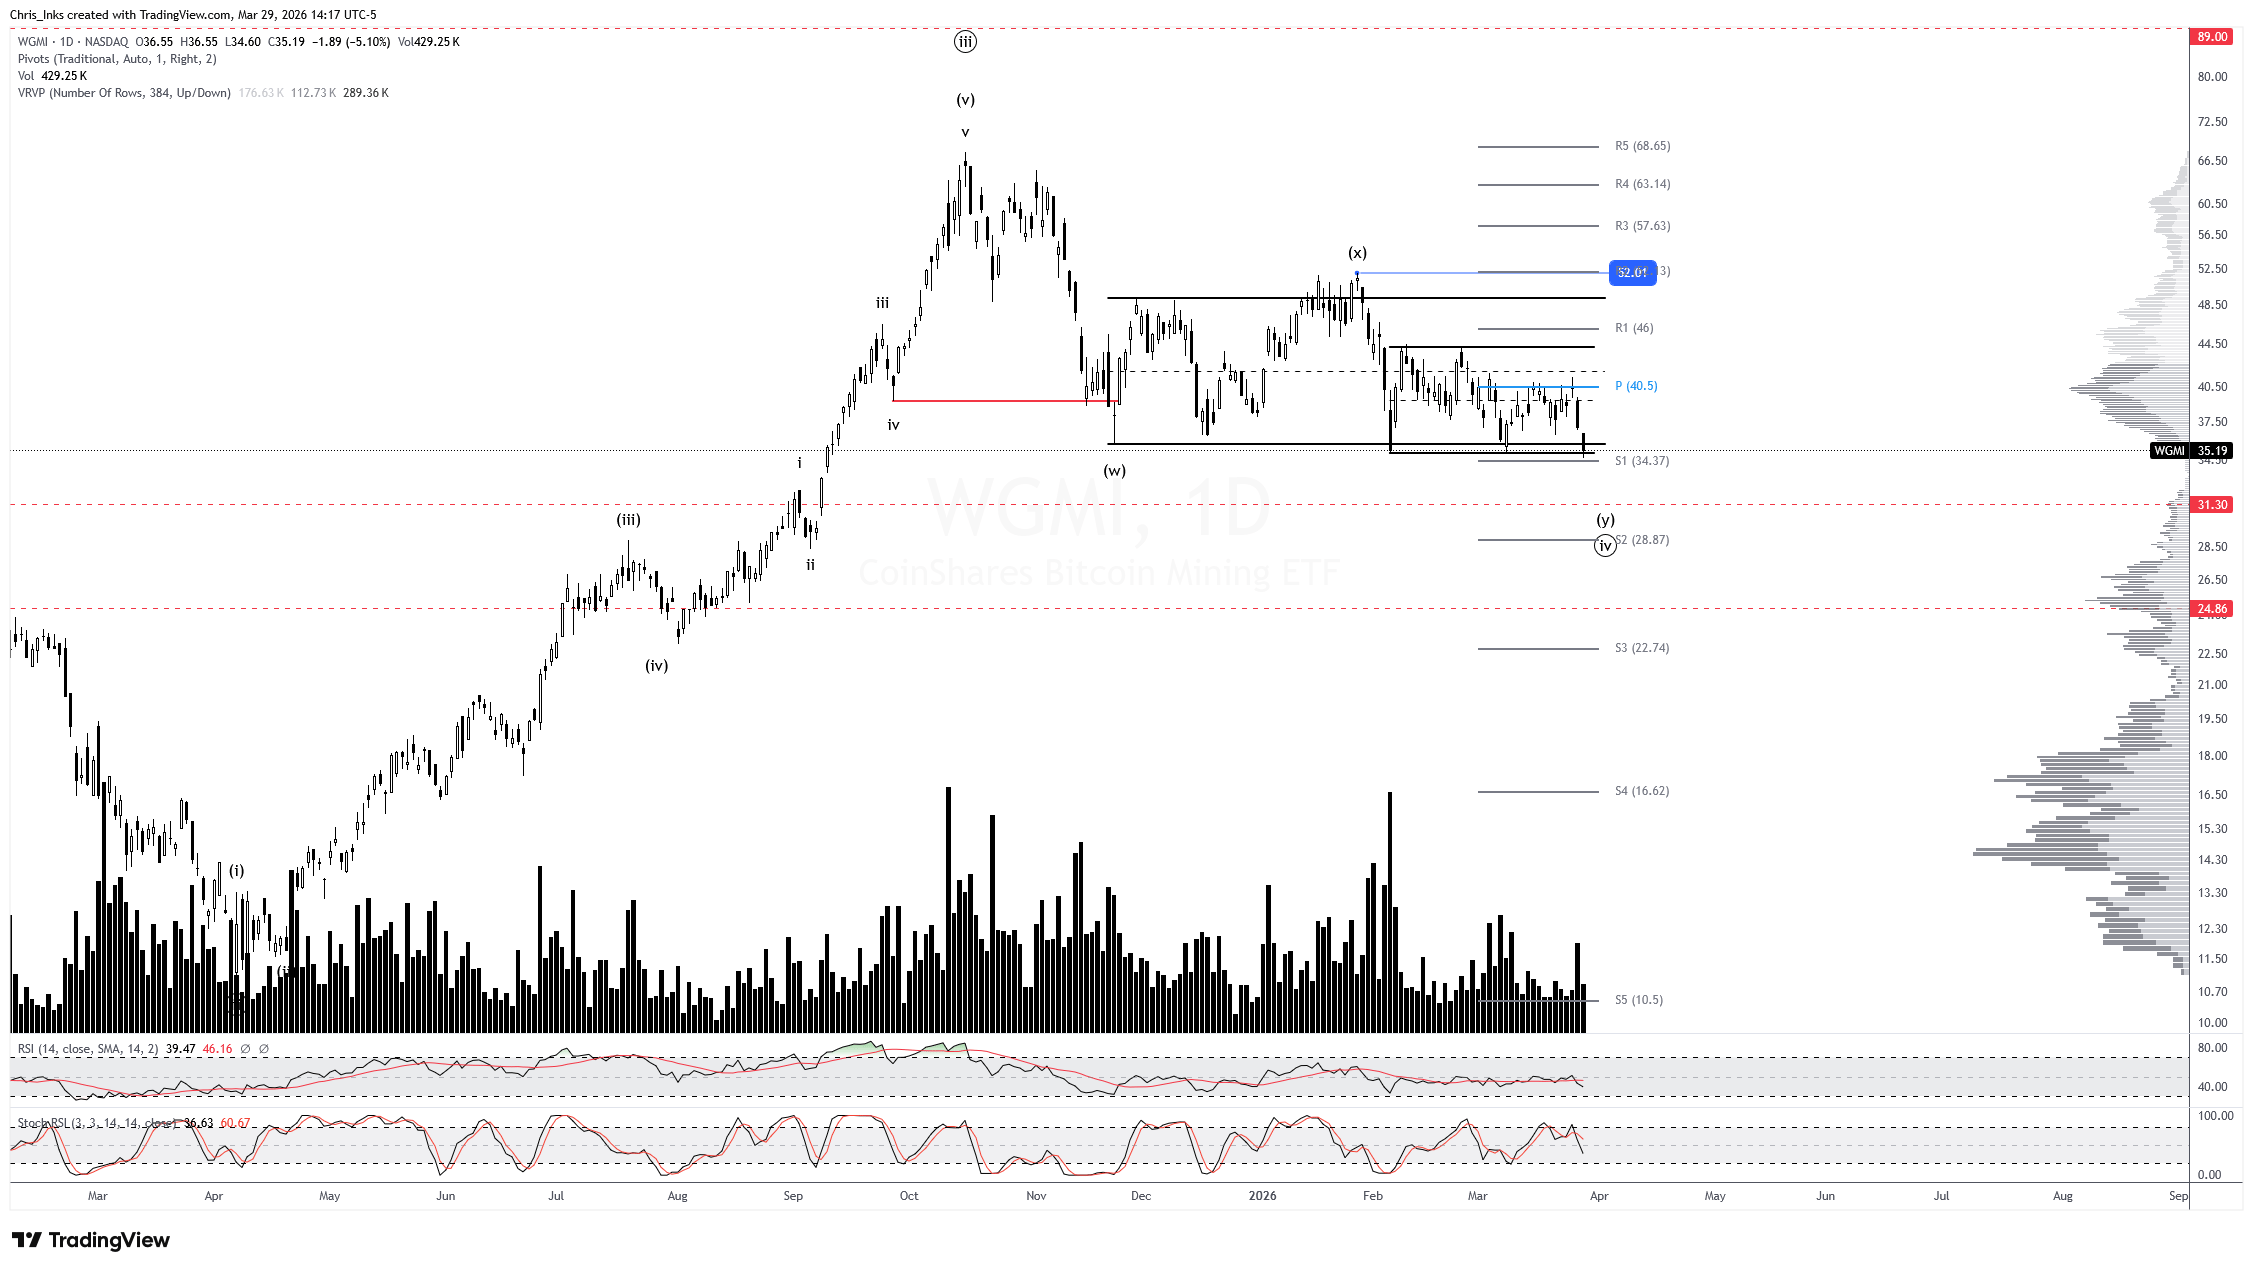
Price swept the wave ((iv)) swing low which keeps wave ((iv)) alive. If price continues lower, then we have an initial local pattern target of ~31.30 and secondary larger pattern target of ~24.86.
Daily candle price acceptance above the local range’s resistance will signal that the low is likely in. Further break out above wave (x) resistance at 52.01 will add confidence to the count. Wave ((v)) has a pattern target of 89.00.
*Target placement is not based on time. I only focus on the target levels.
Hashpower & Geopolitics
Relief week: hashprice rebounds, MARA sells 15,133 BTC, and Washington starts measuring the power war
This past week gave miners a real, measurable improvement in near-term network economics. Hashrate Index’s March 23 roundup showed USD hashprice up 4.9% to $33.65 per PH/s/day, while BTC hashprice rose 8.3% over the same window. The same update showed 7-day average network hashrate up 1.8% to 967 EH/s, with Bitcoin’s latest March 20 difficulty adjustment down 7.76% to 133.79T. That is the cleanest operating signal on the tape right now: miners got a real margin tailwind from the retarget, and the revenue per unit hash actually moved in the right direction this week.
That said, nobody should confuse “better” with “easy.” Hashrate Index was explicit that at roughly $33 per PH/s/day, hashprice is still at or below breakeven for many miners depending on fleet efficiency and operating cost. Its fleetwide revenue table made the same point in a harsher way: sub-19 J/TH fleets are still earning far more per MWh than older machines, and the forward market in that same note was only pricing about $30.42 average hashprice over the next six months. In plain English, the retarget bought breathing room, not a new regime.
The most important company-level signal this week came from MARA, because it put real numbers on the new capital-allocation playbook. On March 26, MARA said it had sold 15,133 BTC for about $1.1 billion between March 4 and March 25, and paired that with agreements to repurchase roughly $1.0 billion face value of 2030 and 2031 convertible notes. The company said the move would capture about $88.1 million in value through discount-to-par repurchases and reduce outstanding convertible debt by roughly 30%. That is not a theory about miners monetizing treasury to fund strategic pivots. That is an actual treasury liquidation and actual deleveraging.
The second corporate signal that mattered was Cipher Digital’s March 25 update, which announced a third data center campus lease, this one a 15-year agreement with an investment-grade hyperscale tenant, plus a new revolving credit facility of up to $200 million with an additional $50 million accordion. The headline here is not branding language about “platforms.” It is duration, tenant quality, and financing. If MARA showed miners are willing to sell bitcoin to fund the transition, Cipher showed lenders and hyperscale counterparties are increasingly willing to underwrite it.
The geopolitical and regulatory tape got a lot more concrete this week, too. On March 24, Reuters reported that the U.S. Energy Information Administration will launch pilot surveys to measure data center energy use in Texas, Virginia, and Washington state. Reuters also noted that the EIA’s prior 2024 survey of cryptocurrency mining operations was halted after miners sued, which makes this week’s move notable: Washington is back in the business of trying to quantify large-load compute, just through a broader data center frame. Two days later, Reuters reported that grid operators and utilities are increasingly pushing data centers to become flexible loads, including reducing power use during peak demand, and noted that during a recent winter storm the Department of Energy told data centers in PJM to run on backup generators to free up grid power.
Texas added the more political version of the same story. Houston Chronicle reporting this week described a $33 billion transmission buildout in Texas that has become a flashpoint partly because residents and some lawmakers believe major portions of it are being driven by future data center demand. Whether the end user is AI training, inference, or a miner-turned-HPC campus, the message is the same: access to megawatts is becoming a political fight, not just a procurement exercise.
Why it matters: this week showed the industry’s three live fault lines at the same time. First, mining economics improved, but only into a still-tight band where efficiency remains everything. Second, miners are now openly monetizing BTC treasuries and layering on long-duration contracts to reposition around AI/HPC infrastructure. Third, regulators are no longer treating large-scale compute as background noise. They are starting to measure it, shape it, and, increasingly, demand that it behave like a grid-responsive industrial load.
Actionable angle: in the next round of monthly production updates and management commentary, watch two hard disclosures. One is whether miners explicitly quantify fleet competitiveness in the $30 to $34 hashprice band, because that is still where the market is living even after this week’s rebound. The other is whether AI/HPC transitions are being funded by BTC sales, real credit facilities, and signed lease terms, or just by presentation slides. On the regulatory side, any miner with Texas or broader U.S. data-center ambitions should now be read through a power-policy lens, not just a hashpower lens.
Signal stat: USD hashprice rose 4.9% to $33.65 per PH/s/day in Hashrate Index’s latest weekly roundup, while Bitcoin difficulty remained at 133.79T after the March 20 retarget, and MARA disclosed the sale of 15,133 BTC for approximately $1.1 billion on March 26.
Beards and Bitcoin simulcasting on Wednesdays at 11:00 a.m. CST
Market Analysis simulcasting on Fridays at 11:00 a.m CST
DISCLAIMER: This newsletter is intended solely for educational purposes and should not be construed as financial advice. It does not constitute an investment recommendation or a solicitation to buy or sell any assets. Please exercise due diligence and conduct your own research before making any financial decisions.
The Bitcoin Miner Stocks Report does not operate as a registered investment advisor. This document is provided purely for informational purposes and does not constitute an offer or invitation to buy or sell any financial instruments. The viewpoints expressed are derived from historical data analysis and are deemed reliable, though their accuracy is not assured. Readers are entirely accountable for any decisions made based on this information.
CFTC RULE 4.41 - These results are based on simulated or hypothetical performance results that have certain inherent limitations. Unlike the results shown in an actual performance record, these results do not represent actual trading. Also, because these trades have not actually been executed, these results may have under-or over-compensated for the impact, if any, of certain market factors, such as lack of liquidity. Simulated or hypothetical trading programs in general are also subject to the fact that they are designed with the benefit of hindsight. No representation is being made that any account will or is likely to achieve profits or losses similar to these being shown.
Reply