- Bitcoin Miner Stocks Report
- Posts
- Miner Chart Watch: Weekly Bitcoin-Mining Stocks Analysis for April 5, 2026
Miner Chart Watch: Weekly Bitcoin-Mining Stocks Analysis for April 5, 2026
Straight price-action snapshots and technical notes.
Christopher Inks
April 05, 2026

1. RIOT Blockchain ($RIOT)
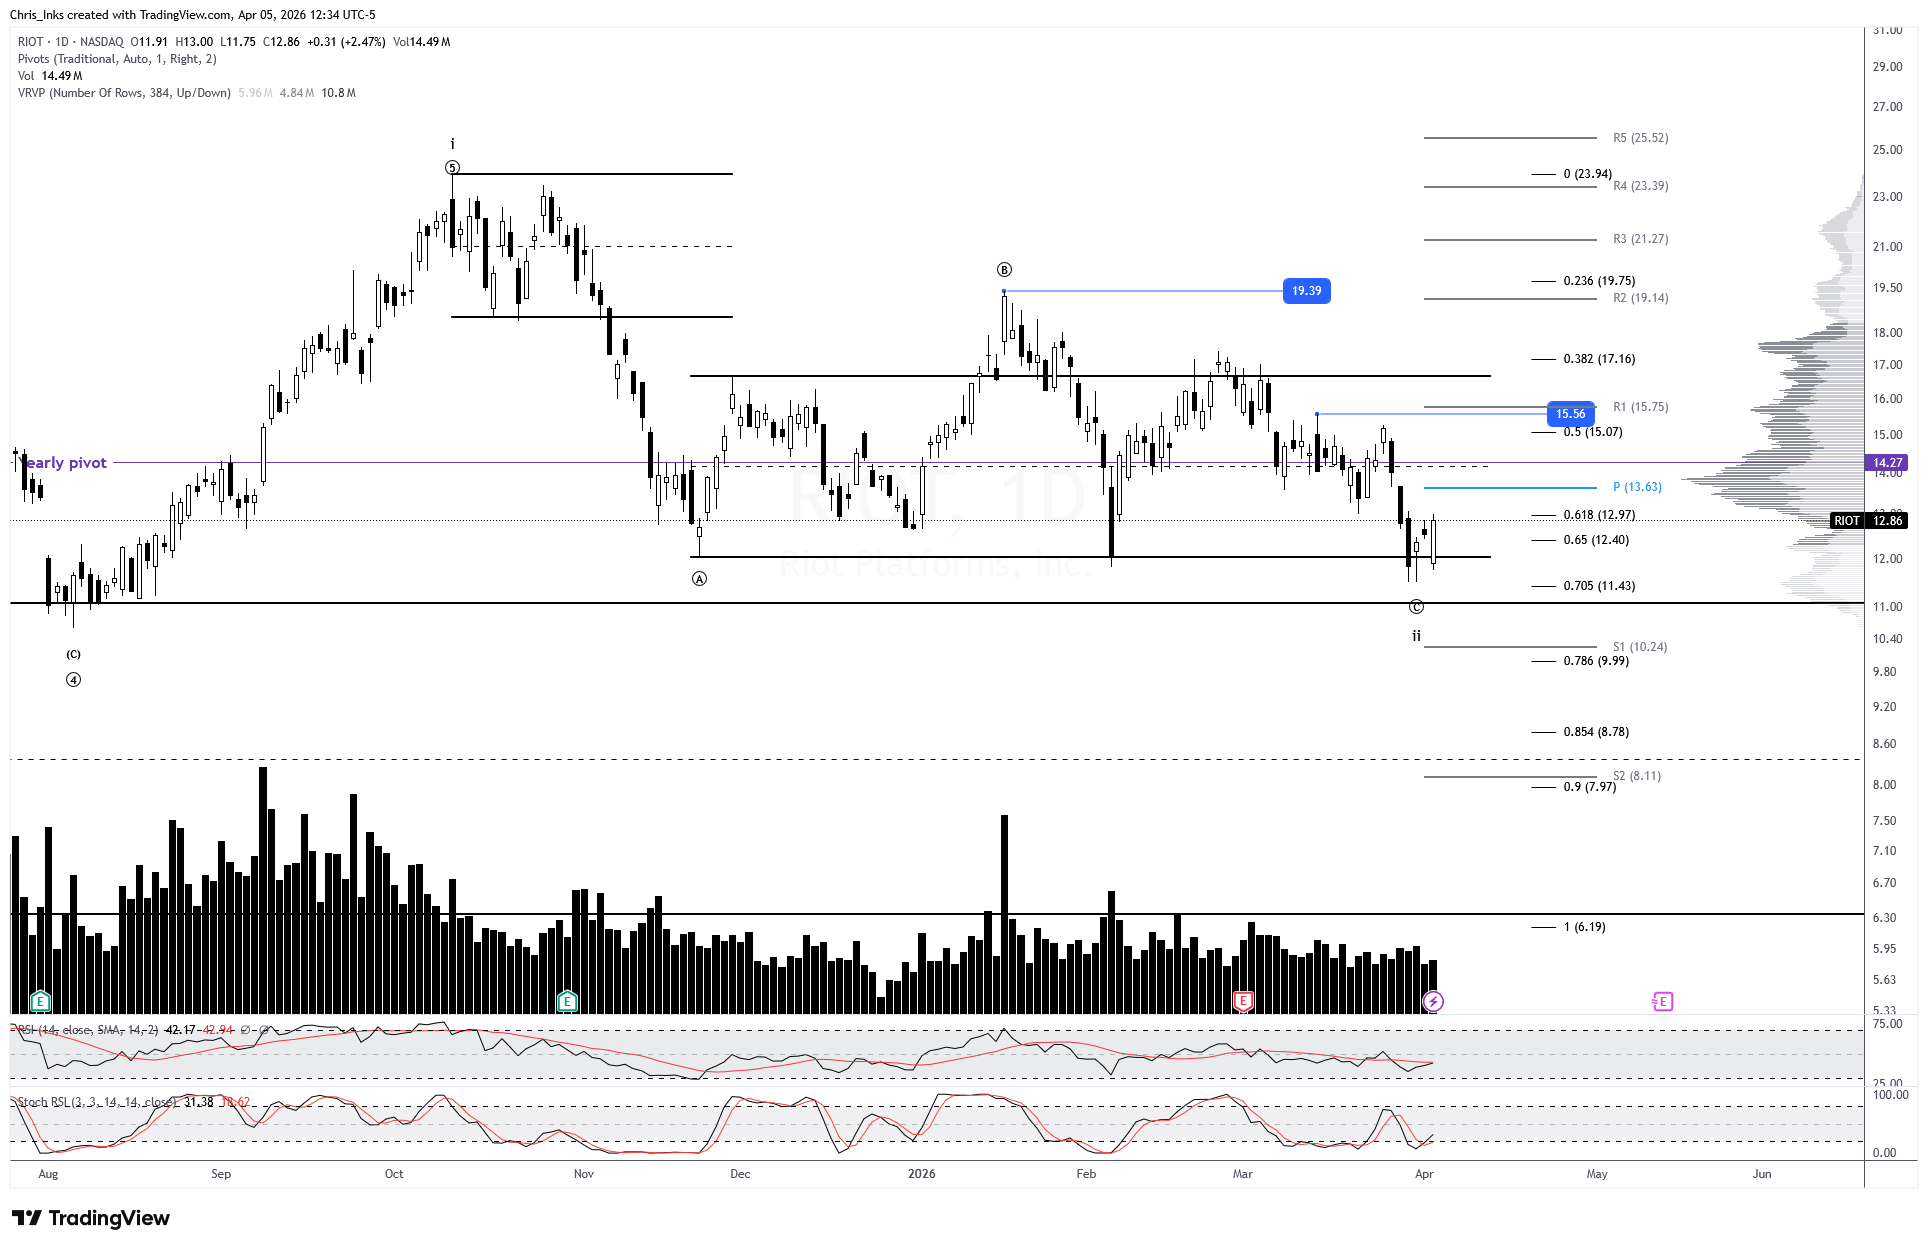
Price swept the wave ii low, keeping it alive, and now sits between the monthly S1 pivot as support and monthly pivot as resistance. An impulsively daily candle breakout and close above the monthly pivot at 13.63 will signal that the pullback is likely complete. Further break out above wave ((B)) at 19.39 will add confidence to the count and indicate that wave iii is likely in progress toward a minimum expected target of ~40.60.
Breaking down below wave ii will keep wave ii alive with a target of the 78.6% retraement level at 9.99, right around the monthly S1 pivot.
*Target placement is not based on time. I only focus on the target levels.
2. Marathon Digital Holdings ($MARA)
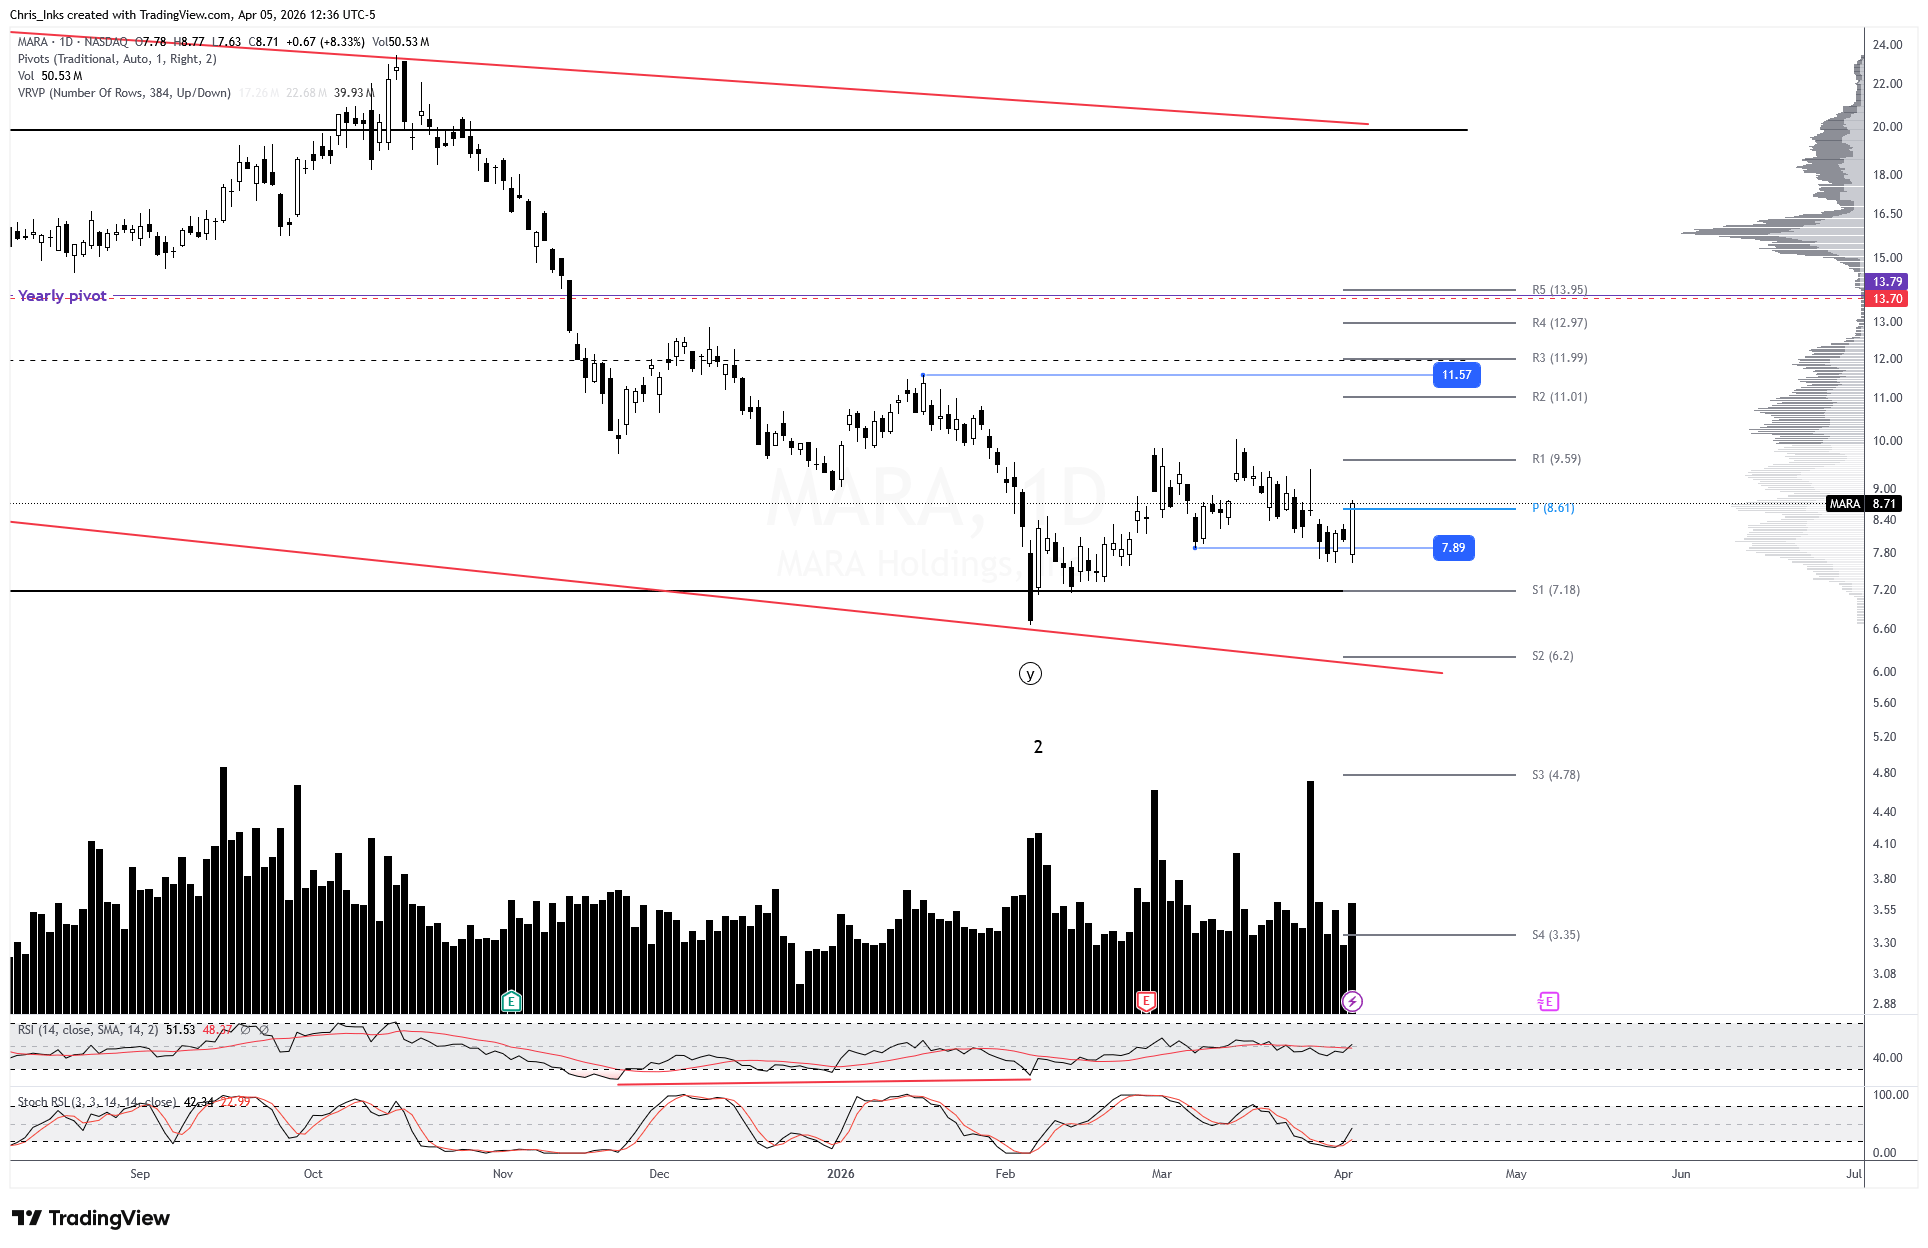
Price tested the swing low just below the 7.89 level and managed to close just barely above the monthly pivot. We want to see further rally on Monday, carrying price into the monthly R1 pivot area at ~9.59.
Breaking out above 11.57 will break the bearish market structure off the wave 1 extreme and set up a move toward the wave ((x)) extreme. As mentioned previously, it’ll take a break out above that wave ((x)) extreme at 30.28 to confirm the wave 2 count. Wave 3 has a minimum expected target of 57.25.
Further decline below that swing low from last week will give us an initial downside target of the monthly S1 pivot at 7.18.
*Target placement is not based on time. I only focus on the target levels.
3. CleanSpark ($CLSK)
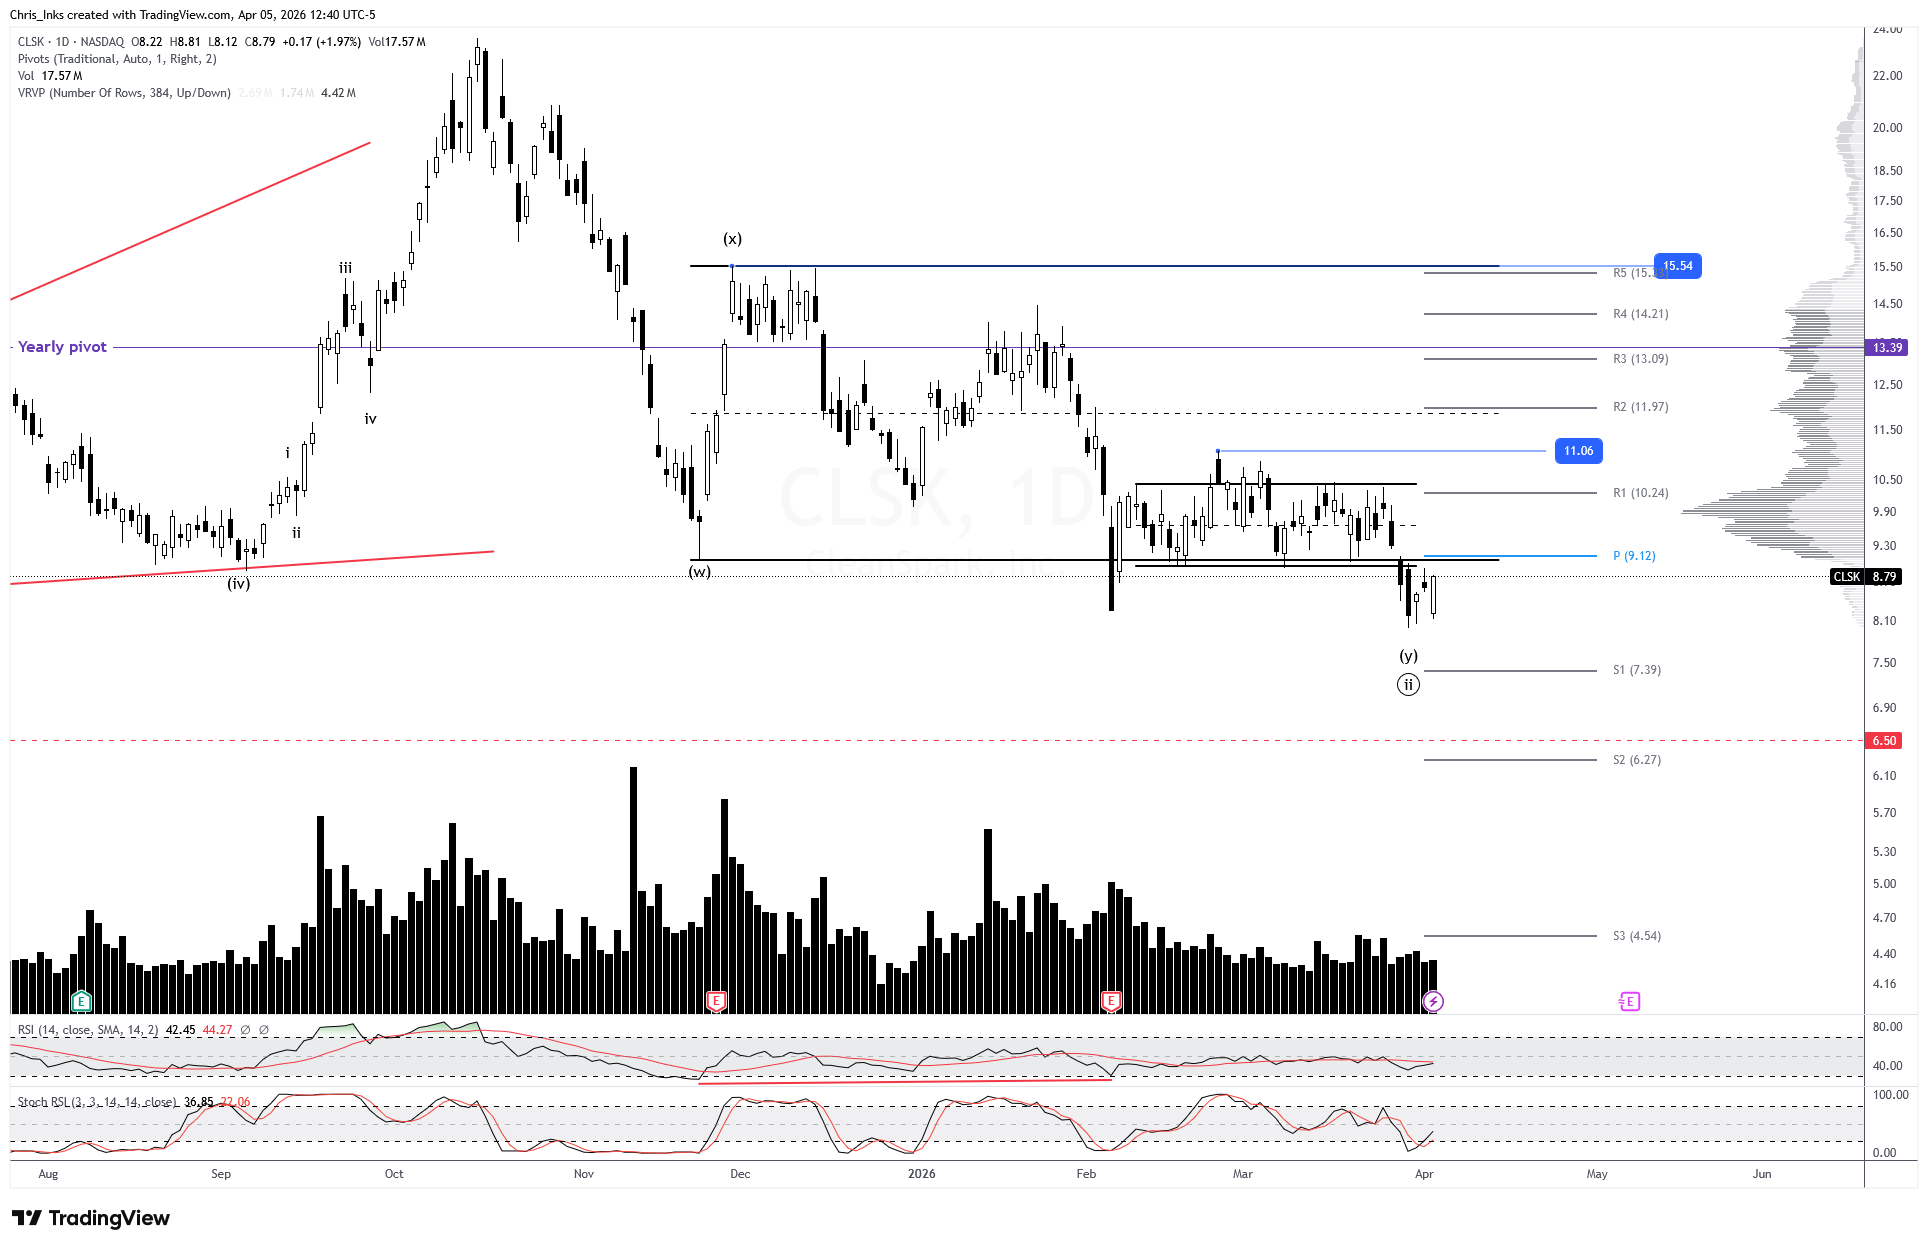
Price swept the wave ((ii)) swing low, keeping wave ((ii)) alive, and bounced back up above it. It is currently sitting between the monthly pivot at 9.12 as resistance and the monthly S1 pivot at 7.39 as support. Further breakdown will have that monthly S1 pivot as the initial downside target, followed by a pattern target of ~6.50.
An impulsive daily candle breakout and close above the monthly pivot will give us an initial target of the 11.06 interior swing high. Breaking out above 11.06 will signal that the pullback is probably complete. Further breakout above wave (x) resistance at 15.54 will add confidence to the count. Wave ((iii)) has a minimum expected target of 36.00.
*Target placement is not based on time. I only focus on the target levels.
4. Bitfarms Ltd. ($BITF)
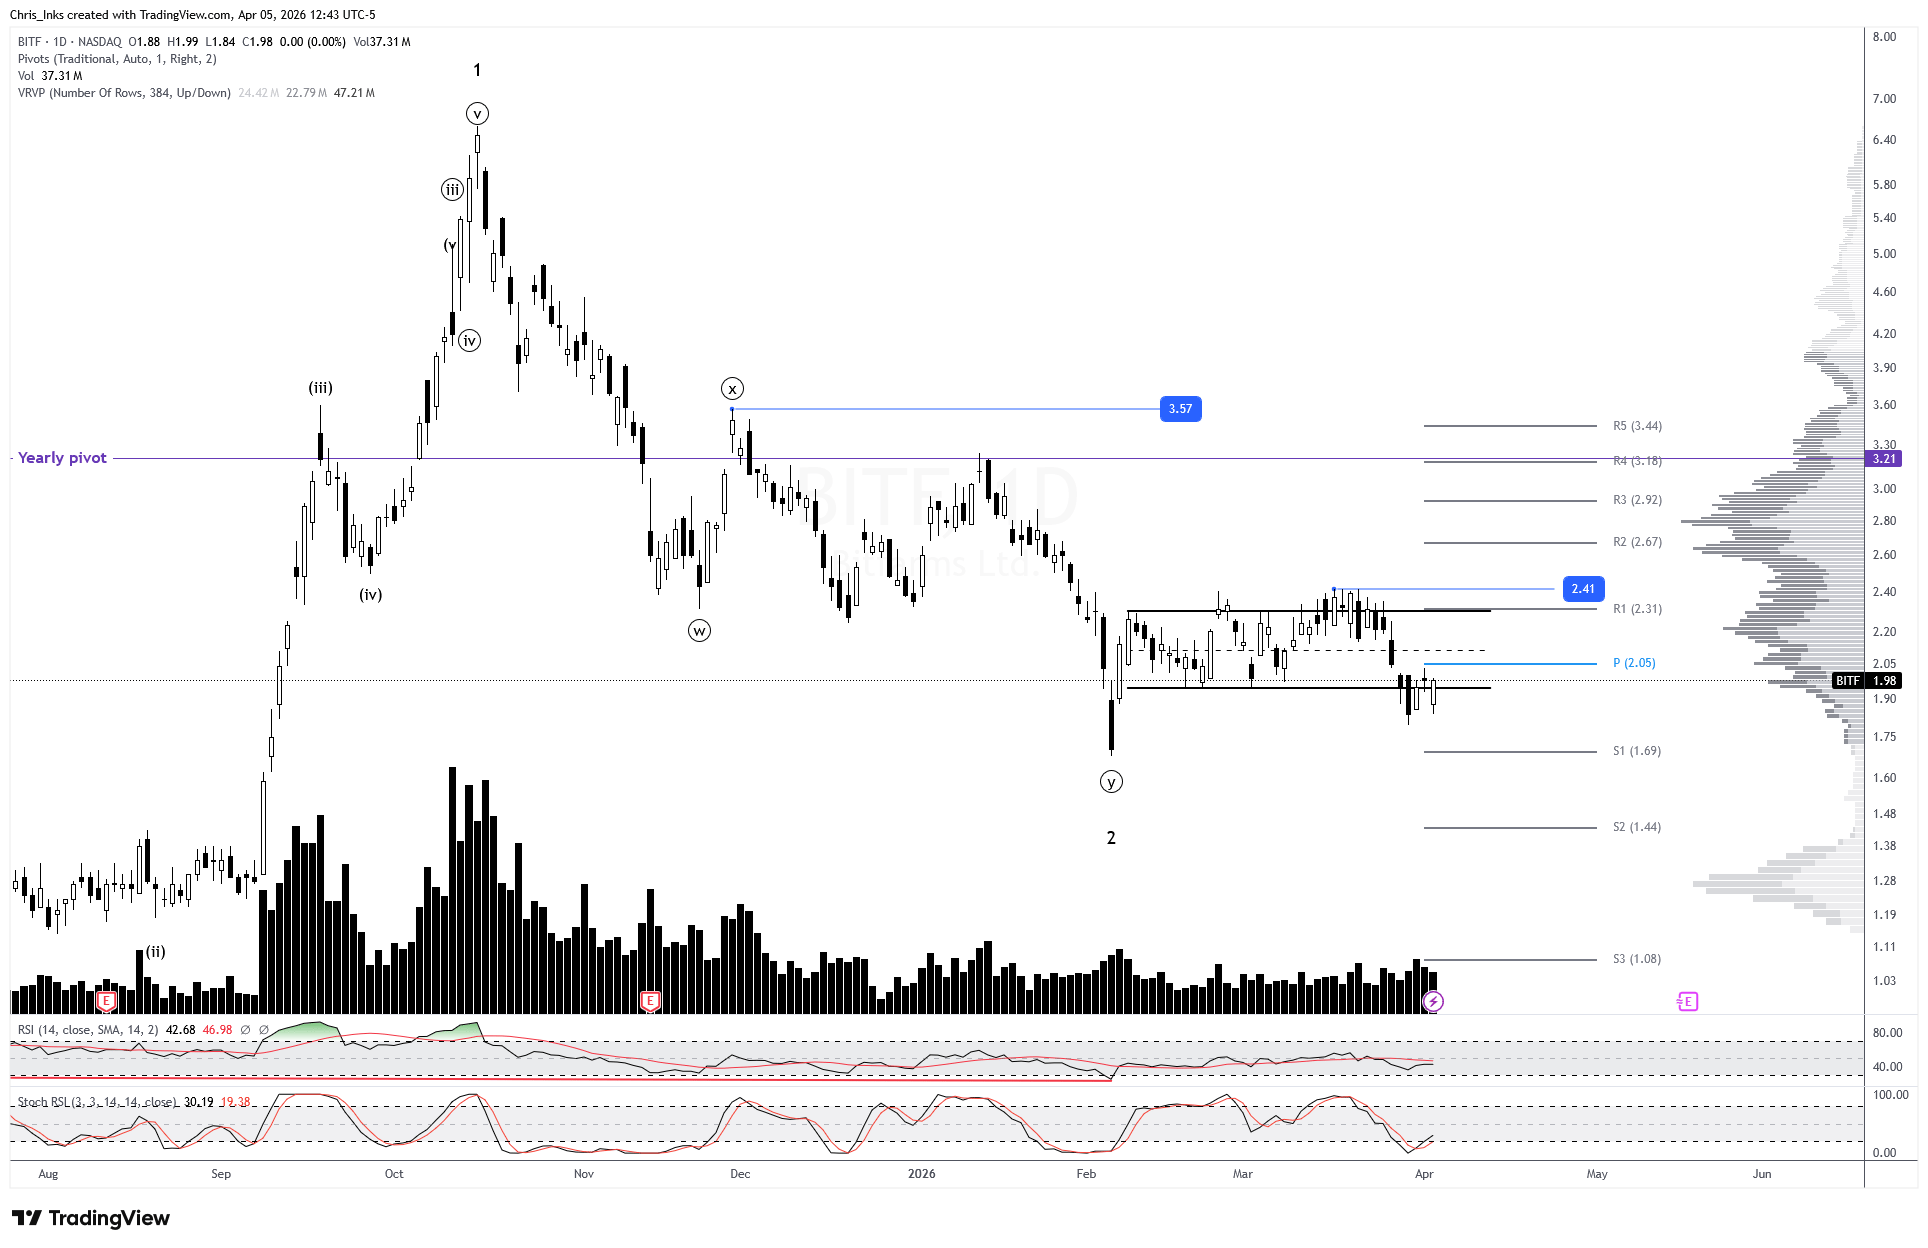
Price swept range support a few more time, but closed just back inside the range again on Friday. A breakdown below last week’s swing low will give us an initial downside target of the monthly S1 pivot at 1.79.
An impulsive daily candle breakout and close above the monthly pivot at 2.05Breaking out and closing above 2.30 will give us a target of the 2.47 internal swing high. Breaking out above that level should likely indicate that the pullback is complete. Further breakout above wave ((x)) resistance at 3.57 will add confidence to the count. Wave 3 has a minimum expected target of 11.25.
*Target placement is not based on time. I only focus on the target levels.
5. Hut 8 Corp. ($HUT)
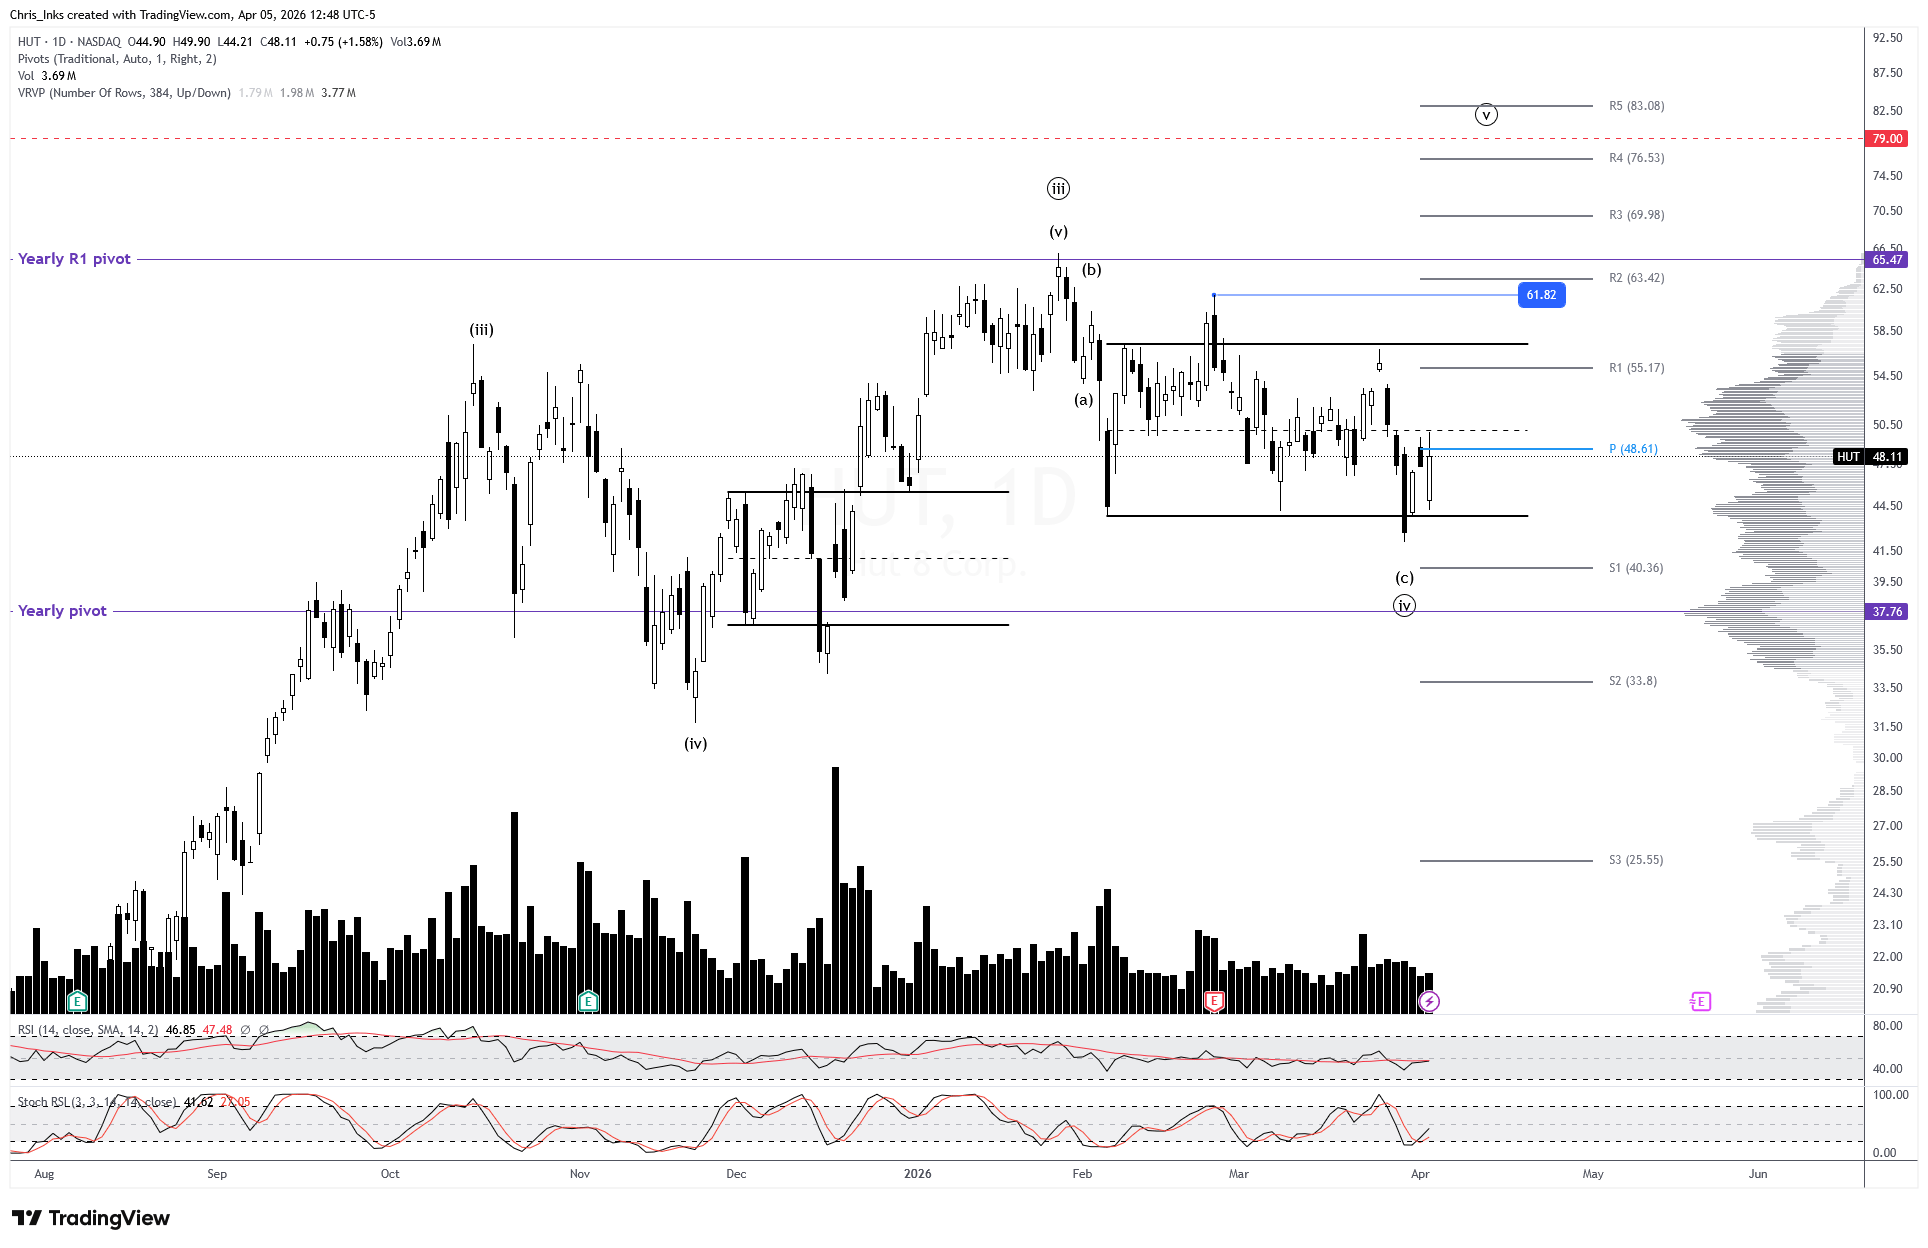
Price swept the wave ((iv)) extreme at the range support, keeping wave ((iv)) alive. But the monthly pivot at 48.61 held as resistance on the bounce. Breaking down further has a secondary target of the monthly S1 pivot at 40.36 followed by the yearly pivot at 37.76.
An impulsive daily candle breakout and close above 48.61 will give us a target of 61.82. Breaking out above the 61.82 level will set up the pattern target of 79.
Wave ((v)) of 3 has a pattern target of 79. But wave 3 has a minimum expected target of 132.87. So, continued rally through 79 will suggest a possible overextension of wave ((v)) up toward that wave 3 target area.
*Target placement is not based on time. I only focus on the target levels.
6. Argo Blockchain ($ARBK)
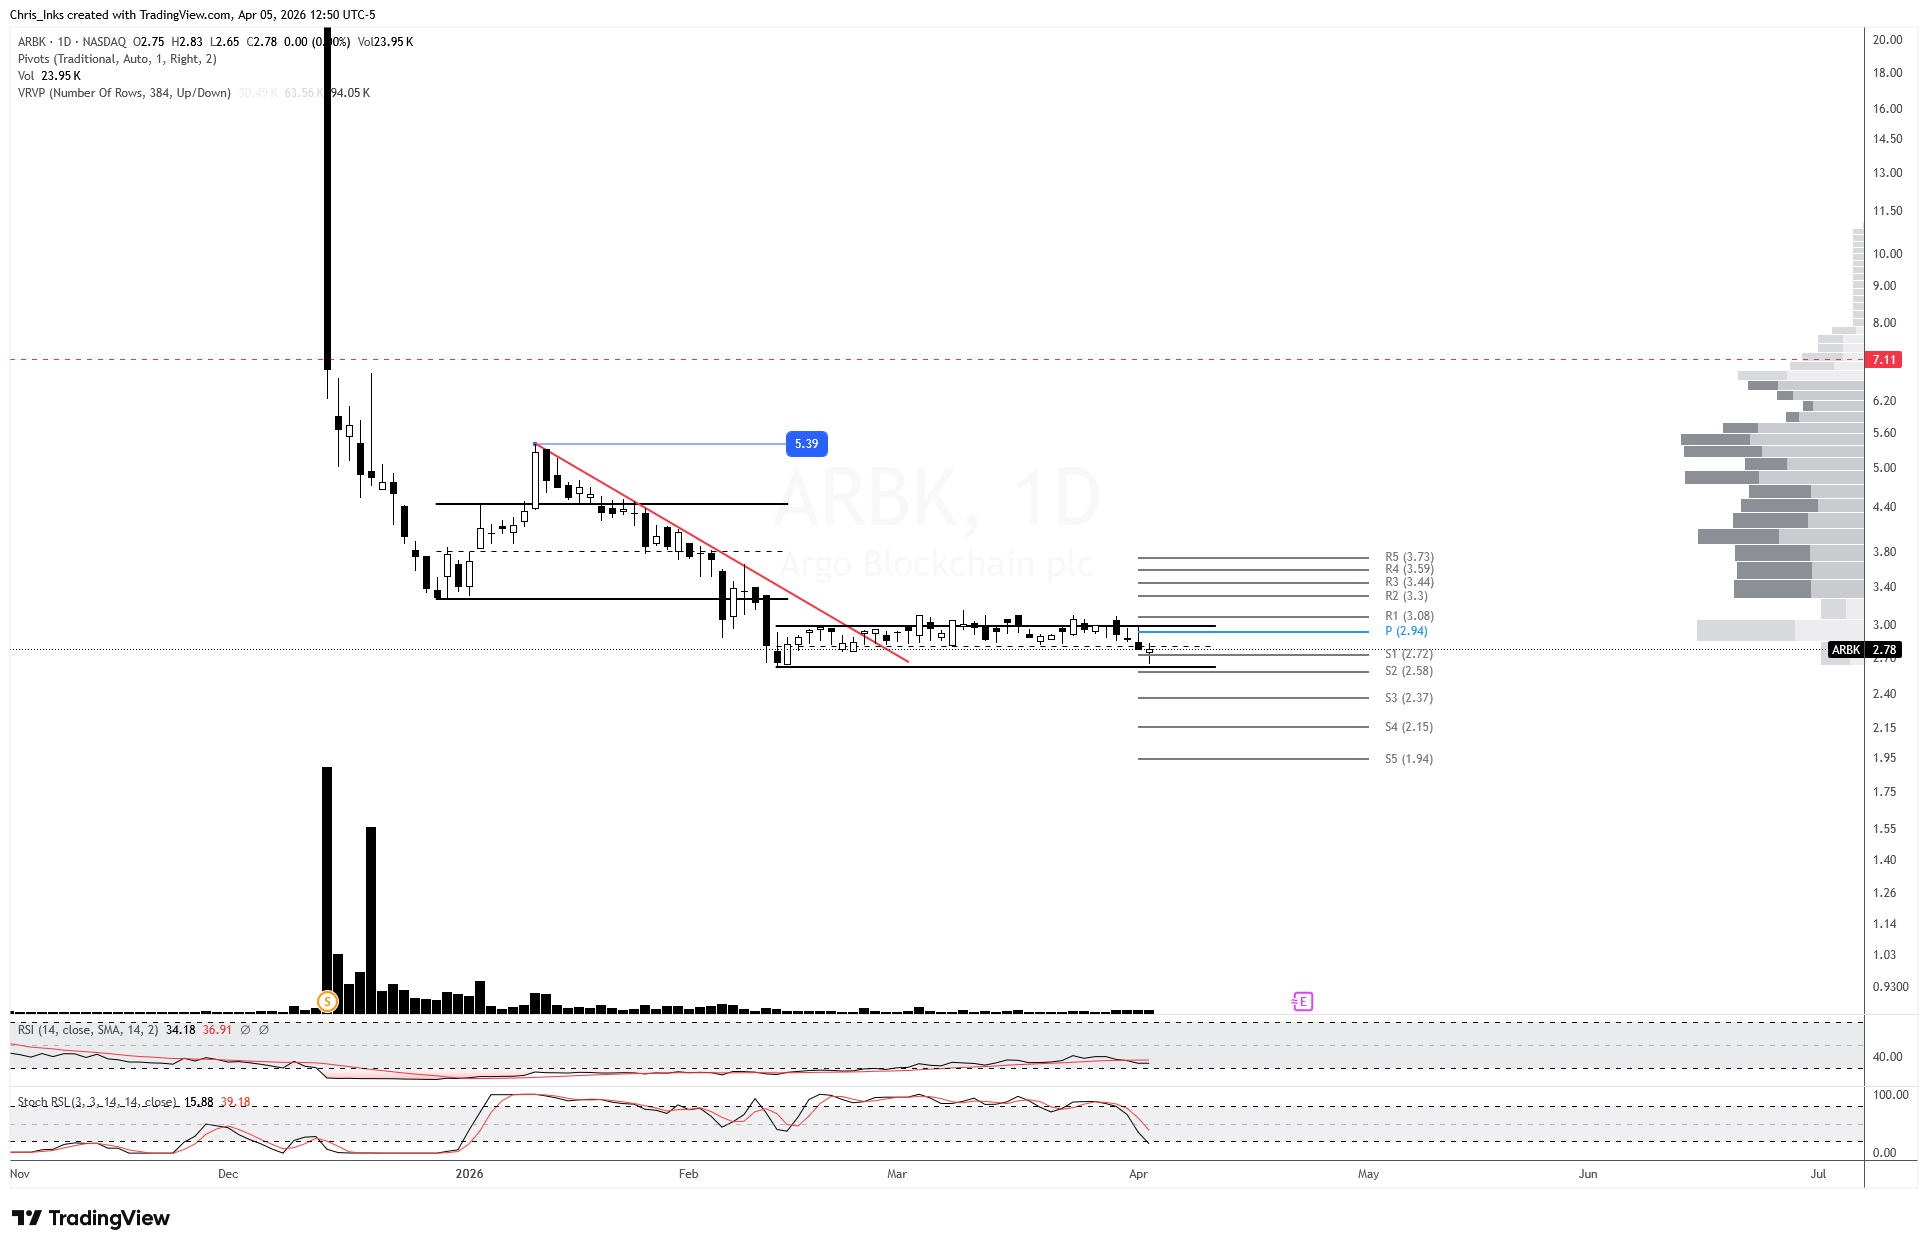
The range since February 12th continues to contain price for now. The monthly S1 pivot is helping the range provide support. A breakout and close above the range resistance will suggest that the low may be in. Further breakout above 5.39 will add some confidence to that scenario. Pushing into the large December 12th daily candle could see price rallying just as strongly back up through it toward 27. But, as usual, traders should be extremely cautious with this one.
Break down and acceptance below range support could see price targeting the monthly R5 pivot at 1.94.
*Target placement is not based on time. I only focus on the target levels.
7. Hive Digital Technologies ($HIVE)
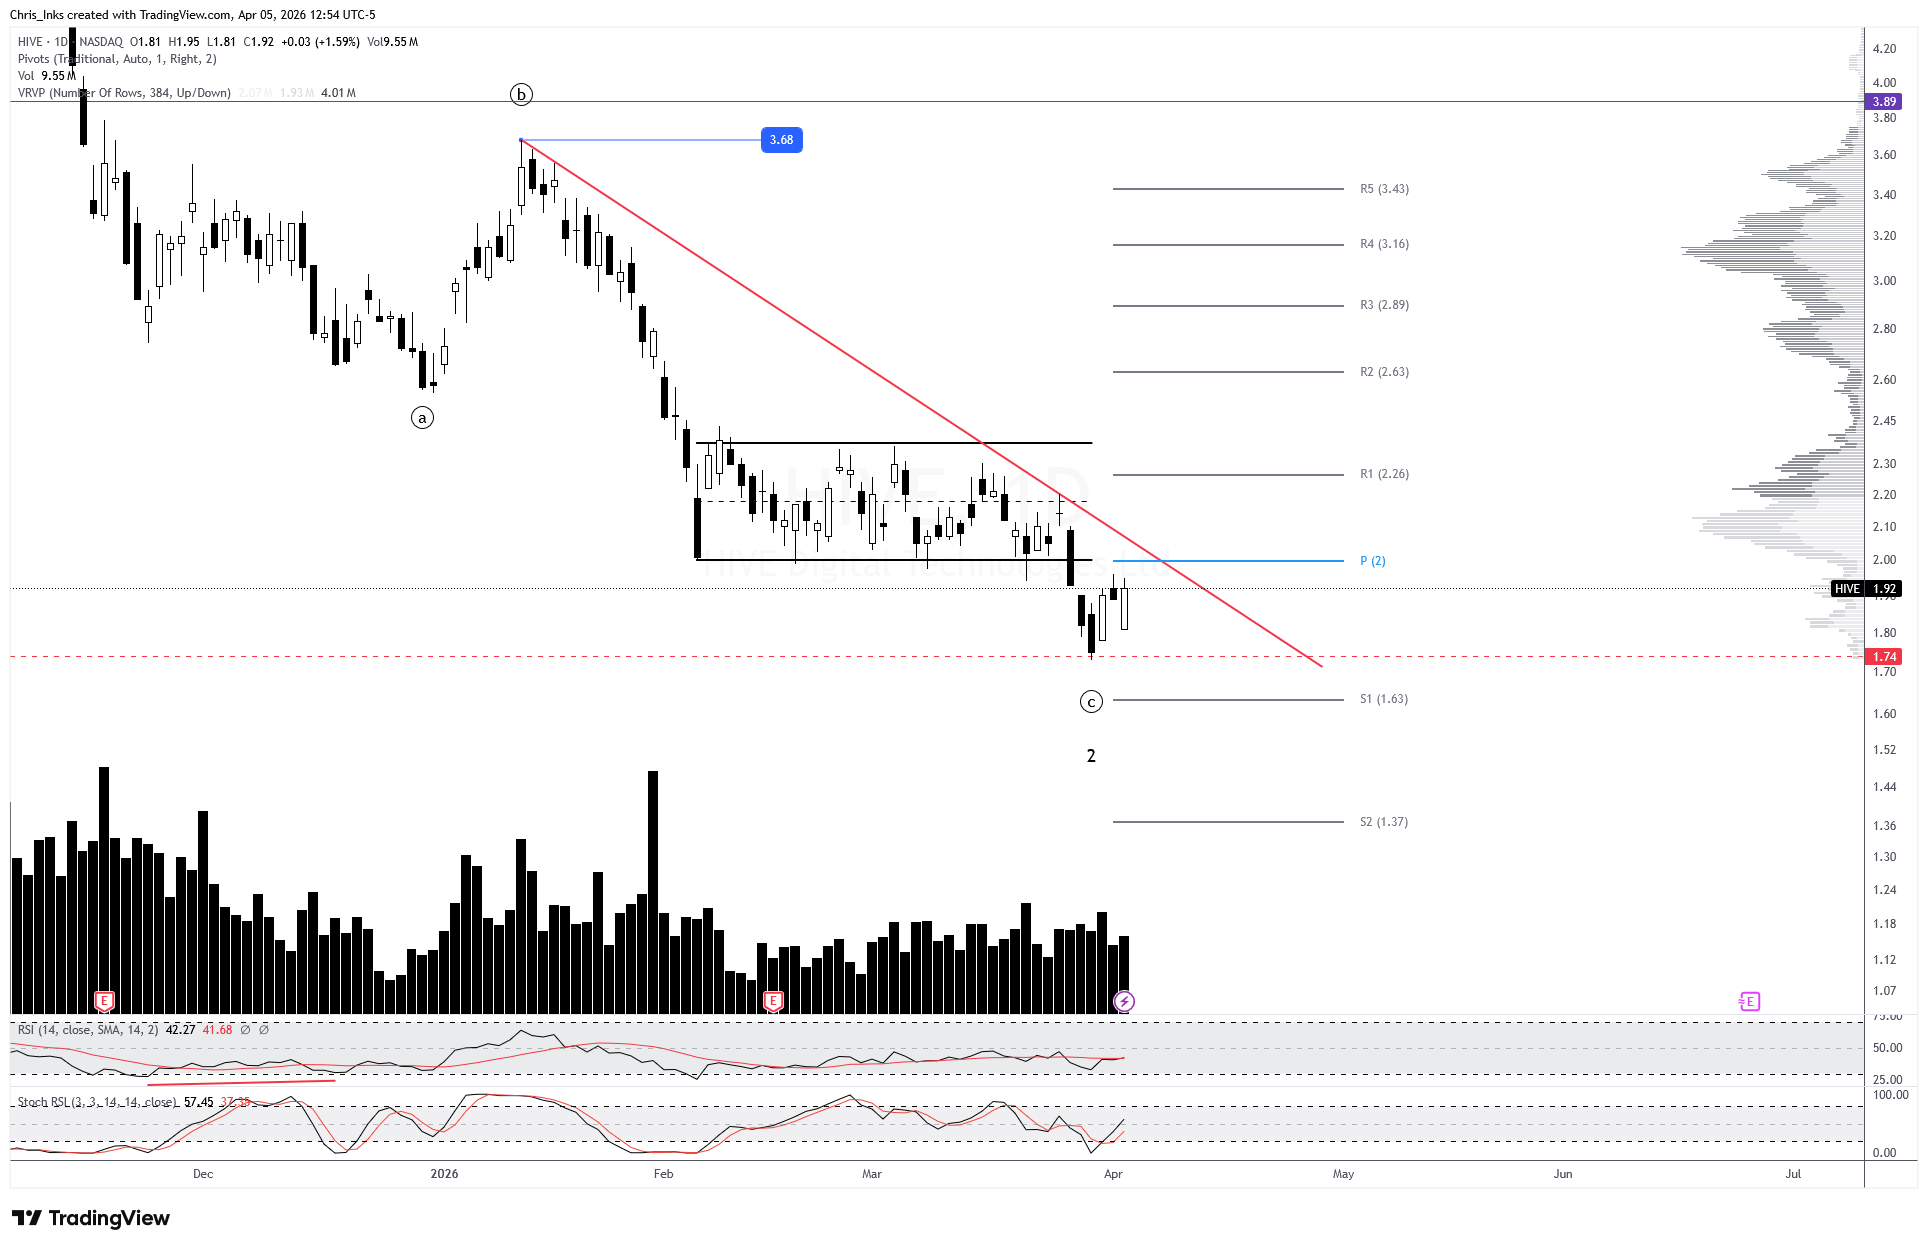
Price hit the pattern target of ~1.74 and bounced almost into the daily pivot. Price pulled back and bounced again on Thursday, finding resistance in the same area.
An impulsive daily candle breakout and close above the descending red resistance will signal that the low may be in. Further break out above wave ((b)) resistance at 3.68 will add confidence to the count. Wave 3 has a minimum expected target of 15.00.
Breaking down below wave 2 instead will keep wave 2 alive with an initial target of the monthly S2 pivot at 1.63.
*Target placement is not based on time. I only focus on the target levels.
8. Terawulf Inc. ($WULF)
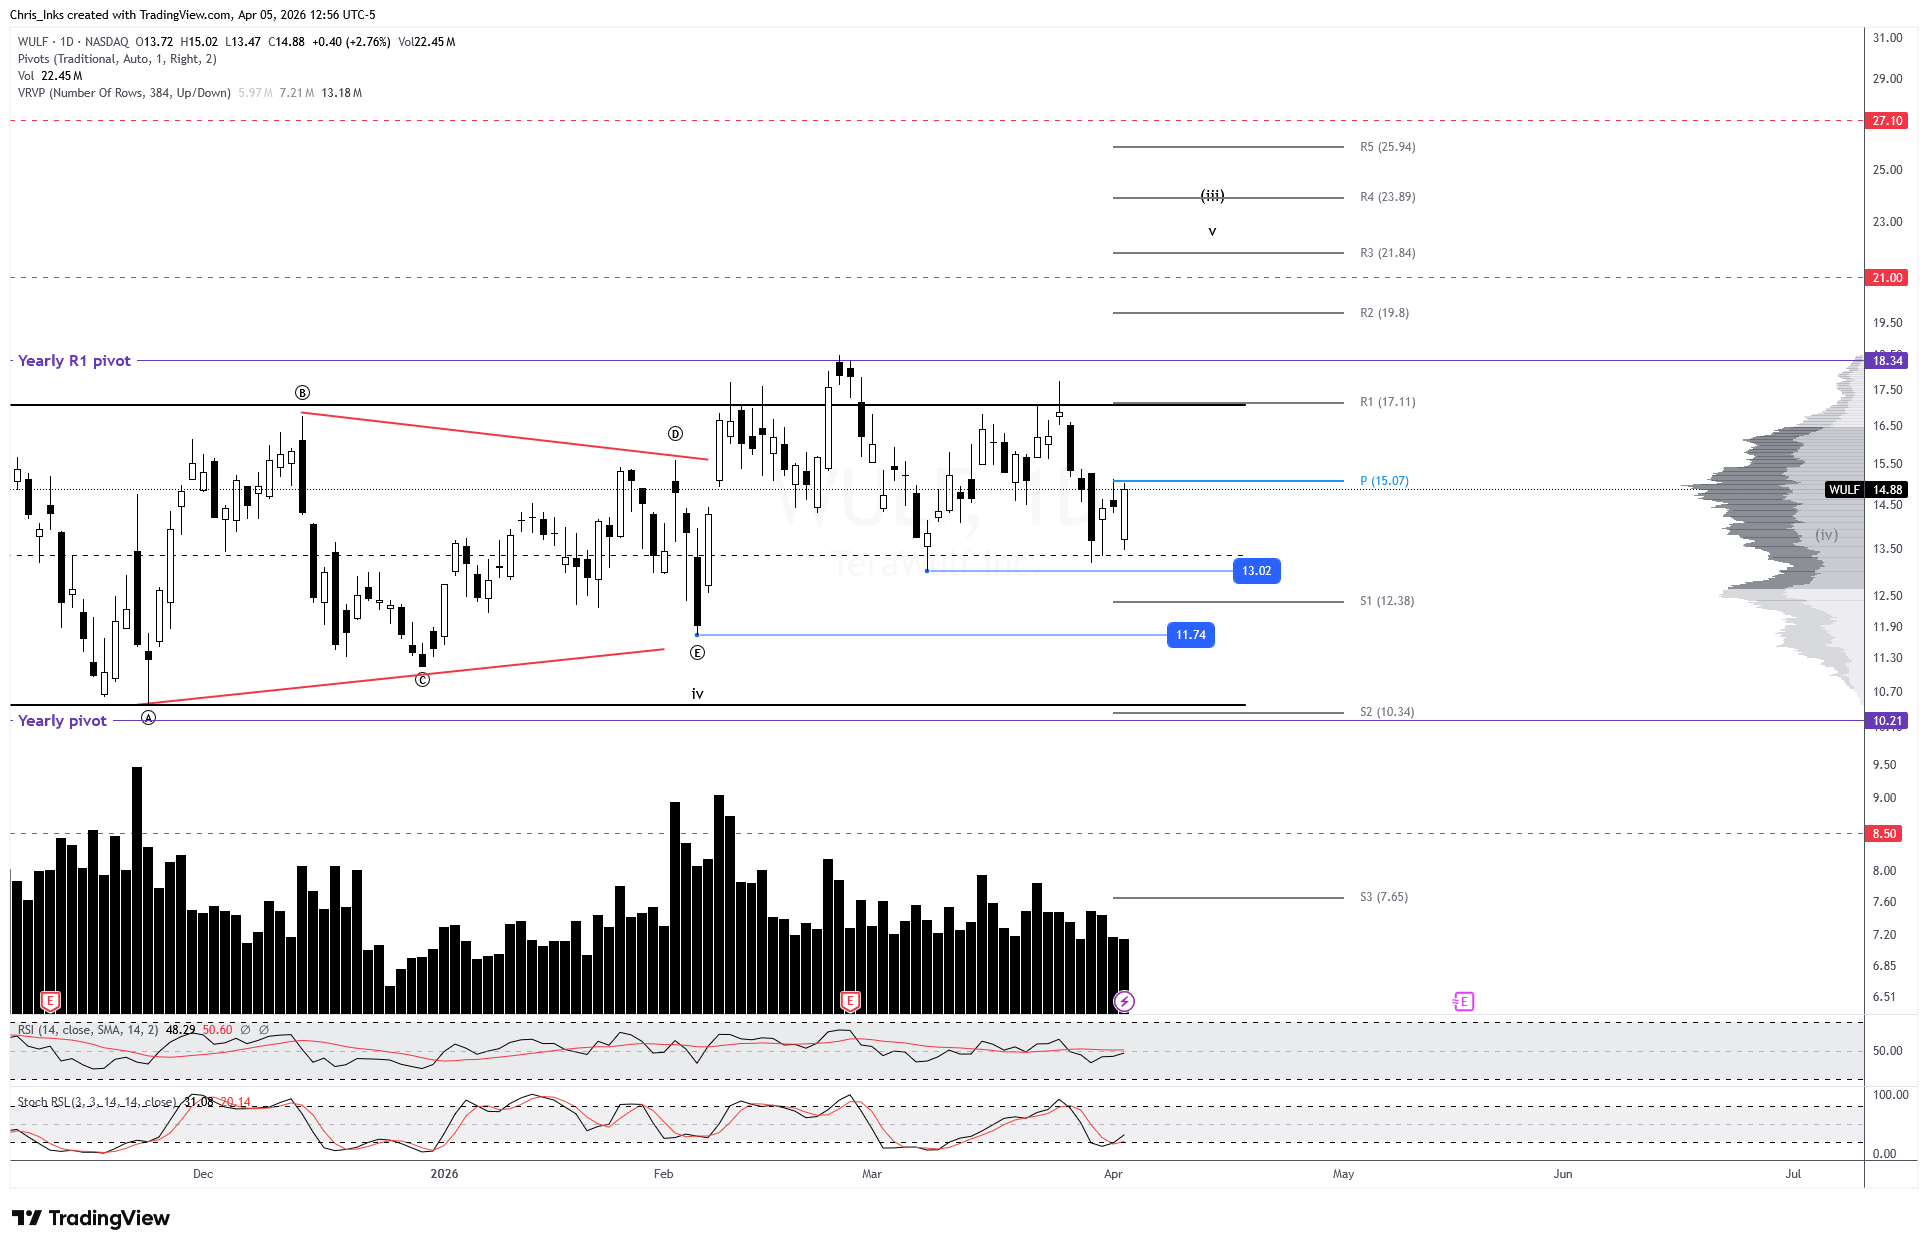
Price pulled back into the range EQ and bounced back up into the monthly pivot at 15.07. Continued decline below the local swing low at 13.02 has an initial downside target at the monthly S1 pivot at 12.38. Breaking down below wave iv triangle support at 11.74 will indicate that either price didn’t print a triangle and, instead, wave iv is still in progress and printing an expanded flat correction (which will have price at least sweeping the yearly pivot), or that wave v completed with the slight breakout above the wave iii extreme. The former is more likely than the latter at this time.
If wave iv triangle support holds, then wave v of (iii) has a pattern target of 21.00 based on the height of the triangle. It has a secondary target of 27.10.
*Target placement is not based on time. I only focus on the target levels.
9. IRIS Energy Limited ($IREN)
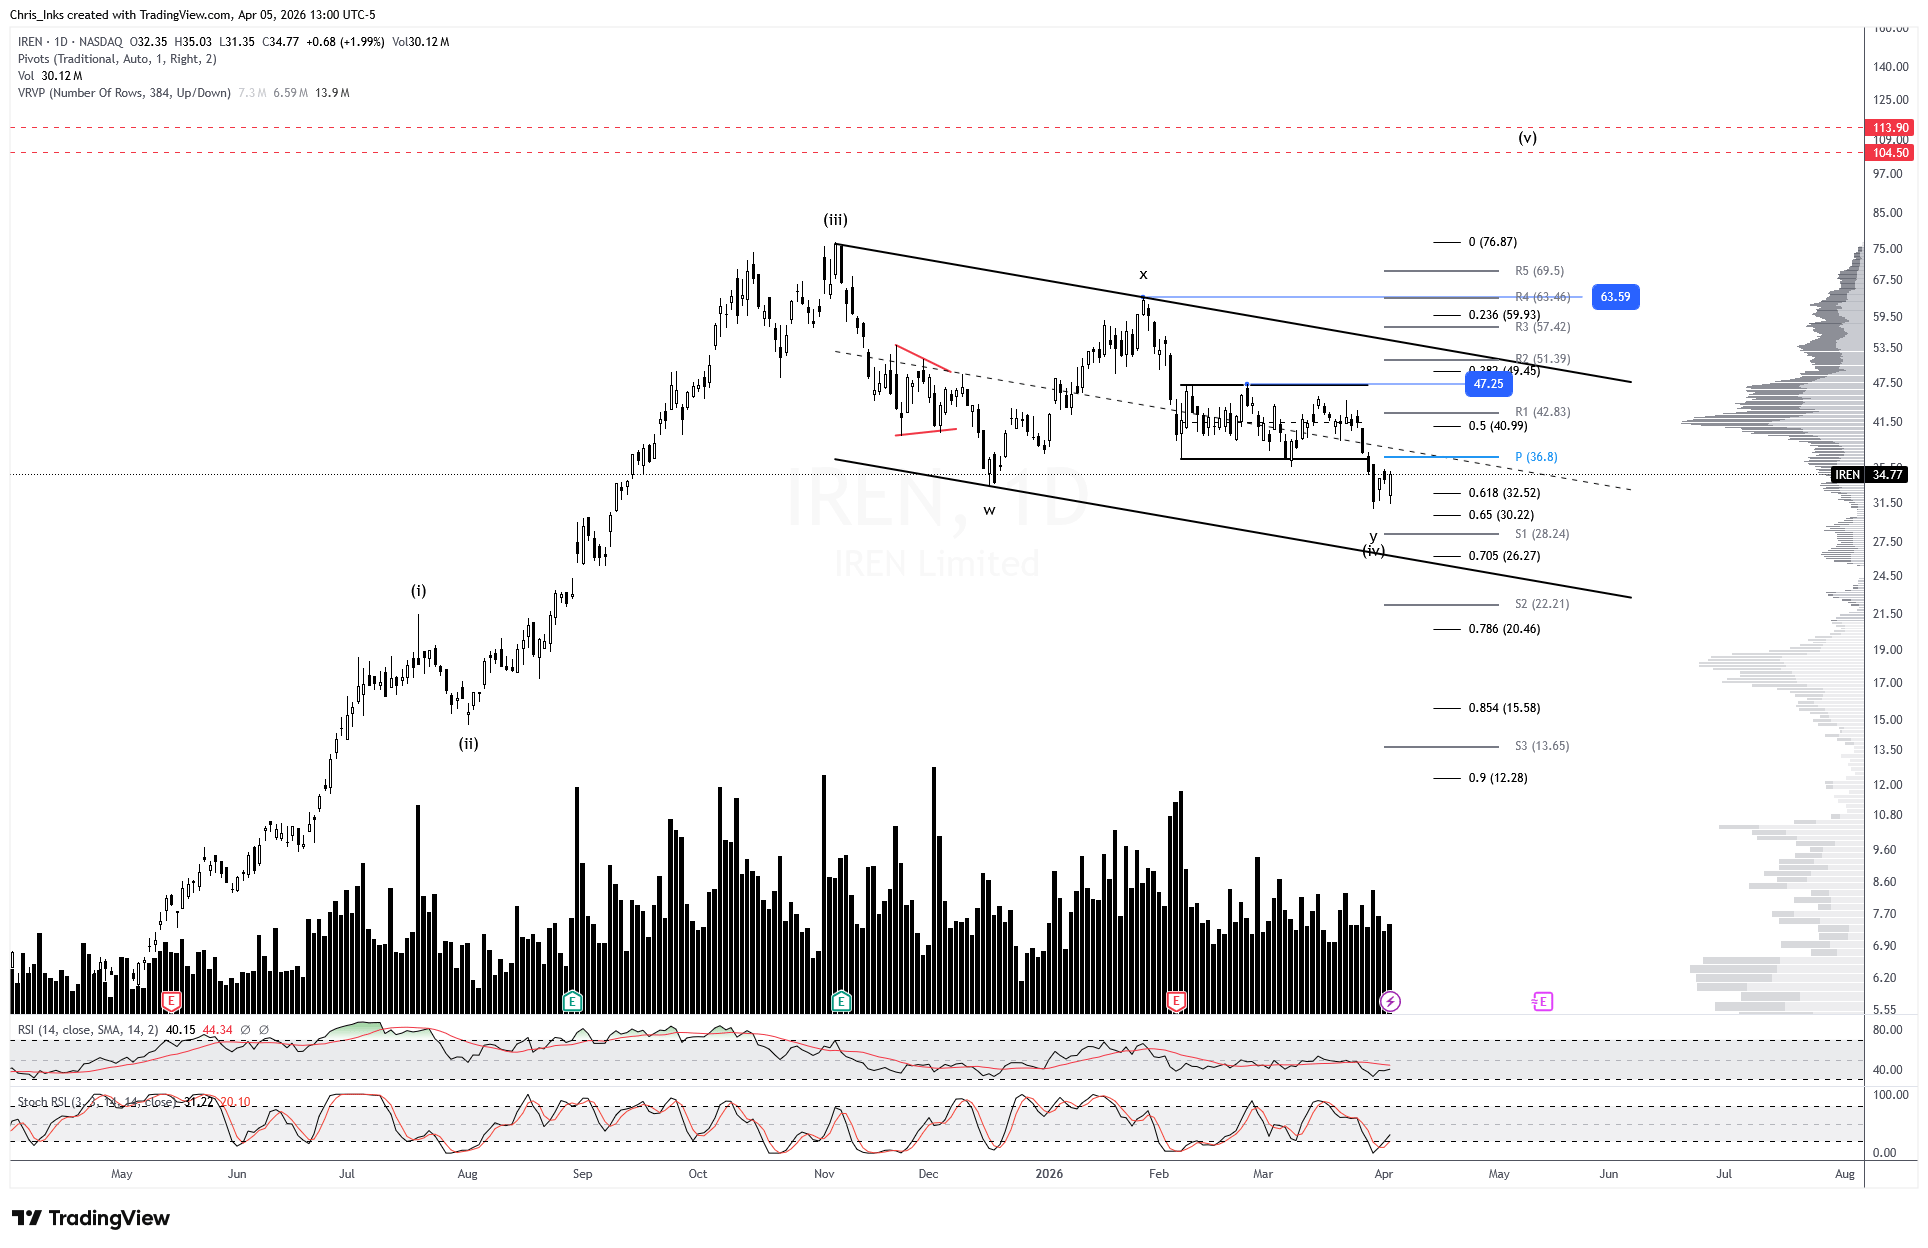
Price continued to dip just below the wave (iv) support, keeping wave (iv) alive. Continued decline this week will give us an initial downside target of the monthly S1 pivot at 28.24, keeping wave (iv) alive longer.
An impulsive daily candle breakout and close above the monthly pivot at 36.80 will give us a local target of 47.25. Breaking out above 47.25, while holding the wave (iv) swing low, will signal that the pullback is likely complete. Wave (v) has a pattern target of 104.50 and secondary target of 113.90.
*Target placement is not based on time. I only focus on the target levels.
10. Core Scientific, Inc. ($CORZ)
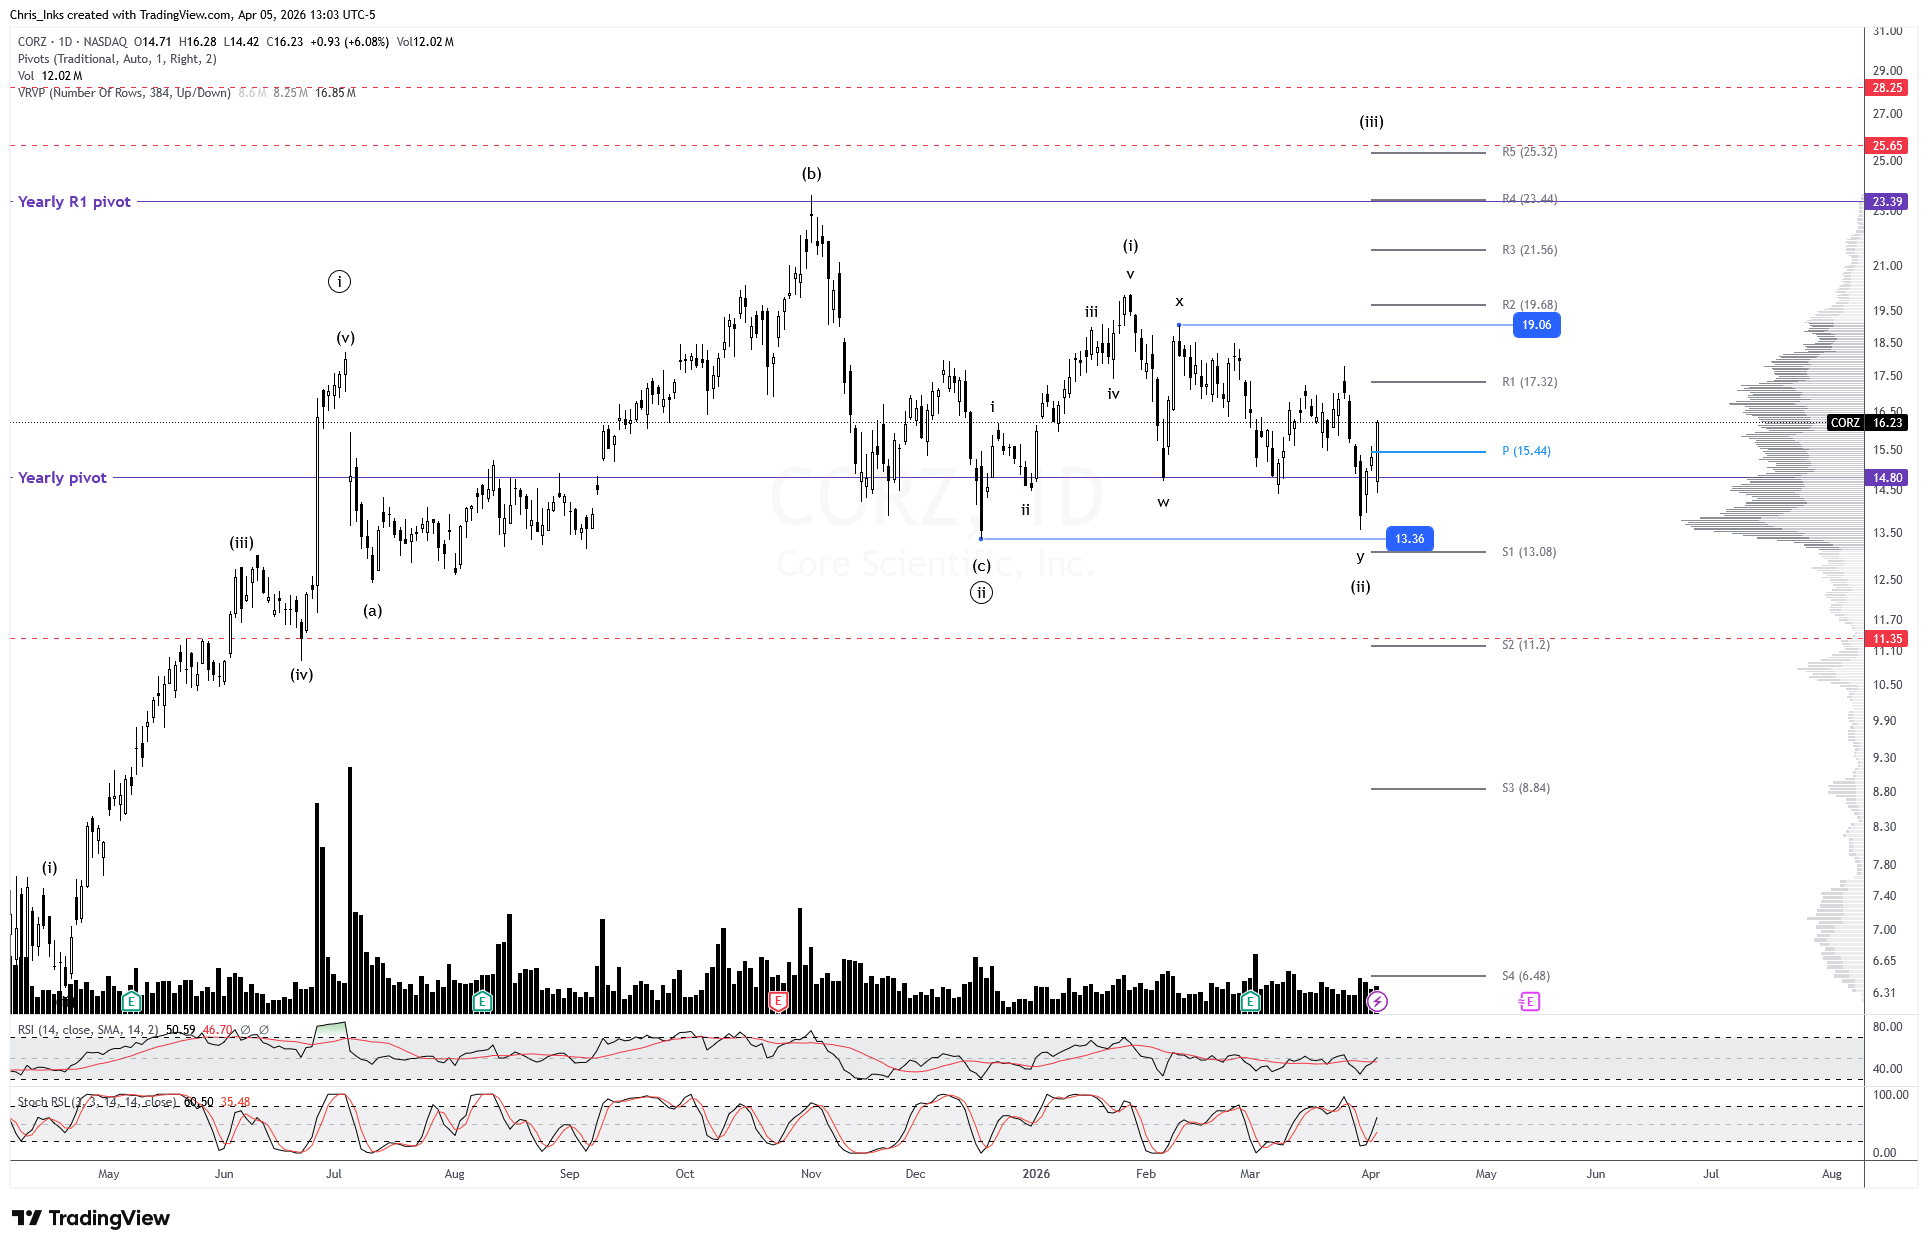
Price swept the wave (ii) low, keeping wave (ii) alive, but remained above the larger degree wave ((ii)) swing low. It then bounced up through the monthly pivot and closed above it on Friday. That gives us a target of 19.06. A breakout above wave x at 19.06 will add confidence to the count. Wave (iii) has a minimum expected target of 25.65 and secondary target of 28.25.
Breaking down below the wave ((ii)) swing low will invalidate waves (i) and (ii) while keeping wave ((ii)) alive with a possible target of ~11.35.
*Target placement is not based on time. I only focus on the target levels.
11. Cipher Mining Inc. ($CIFR)
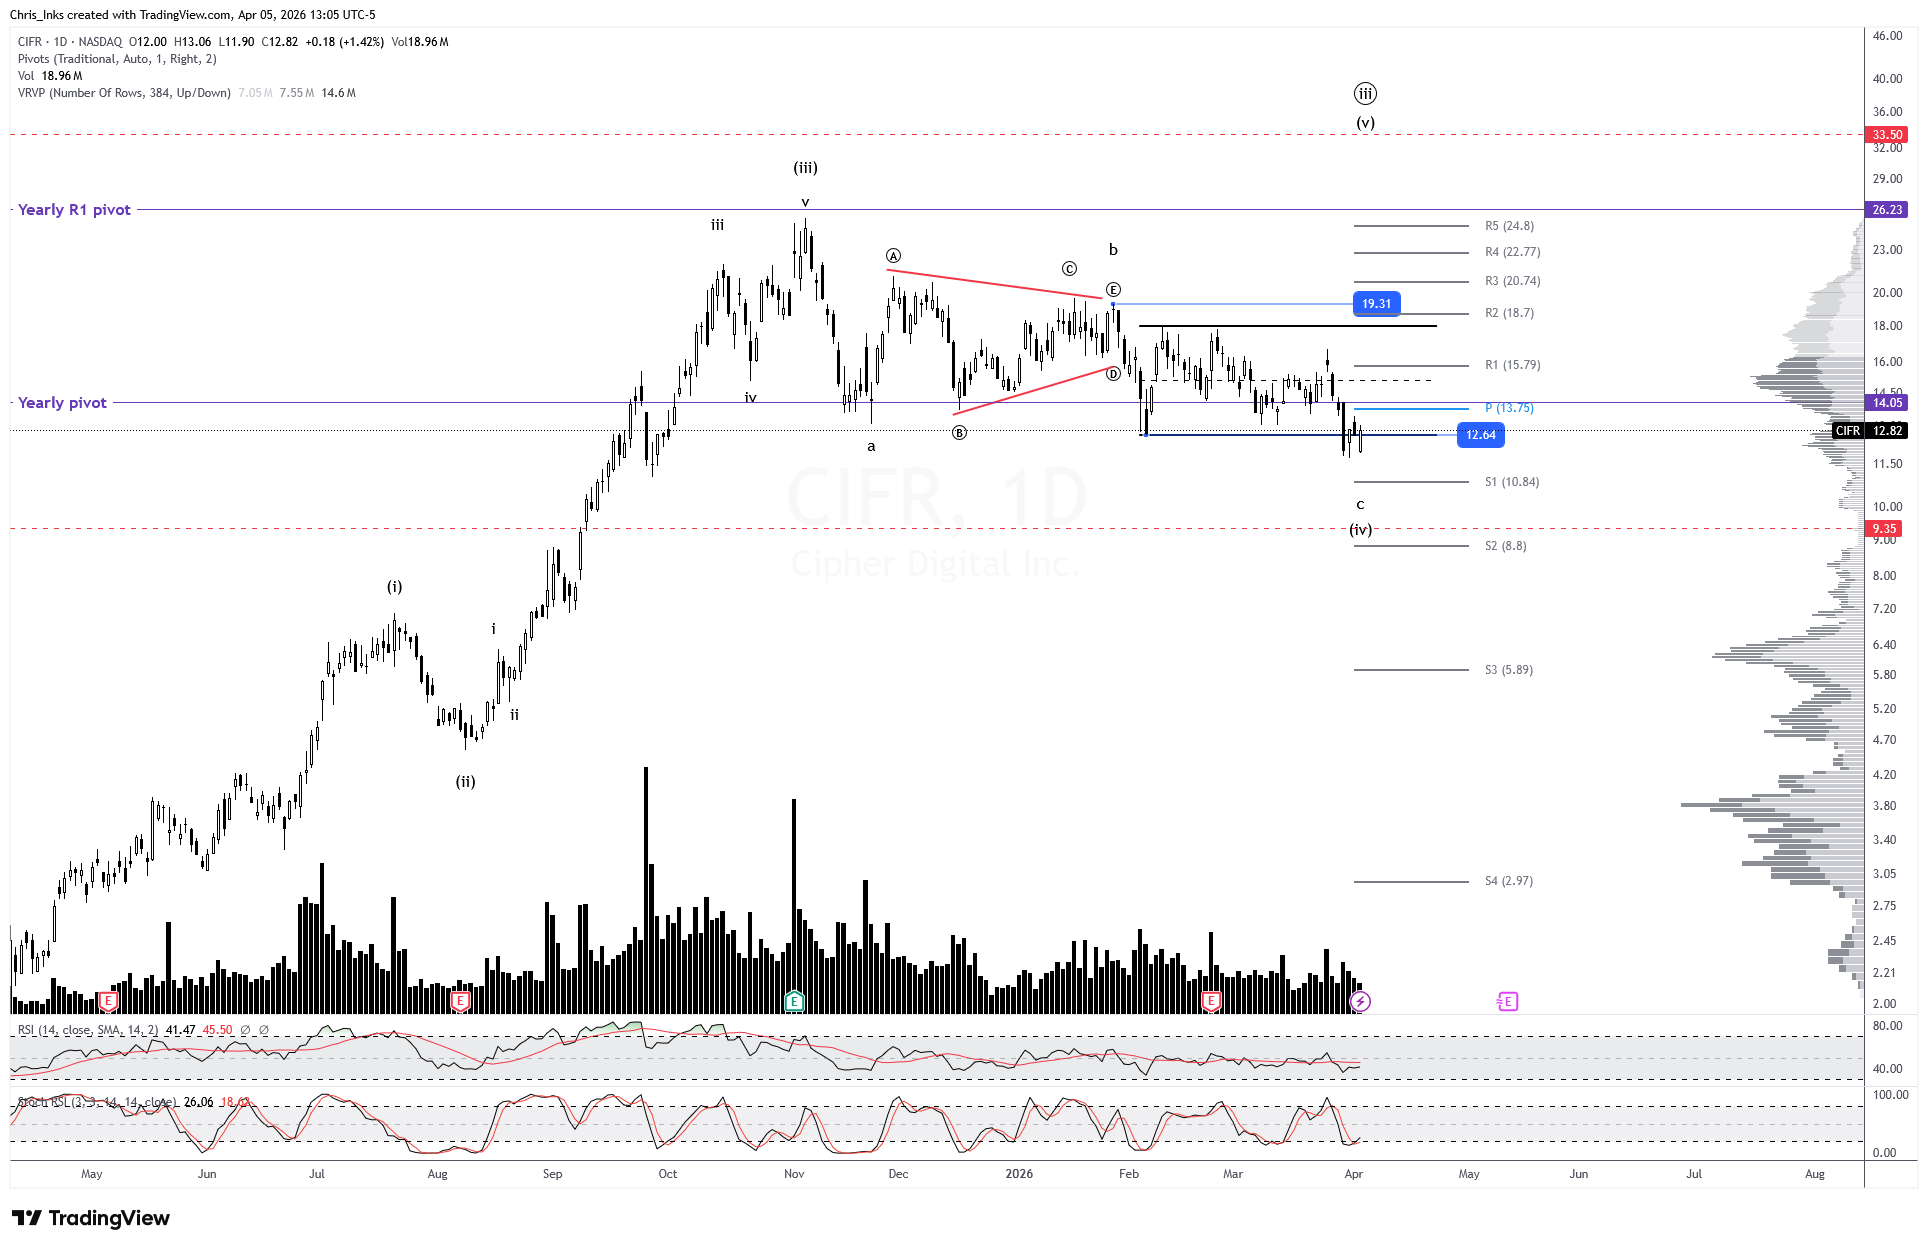
Price swept wave (iv) at 12.64, keeping wave (iv) alive. Continued breakdown has an initial target of the monthly S1 pivot at 10.84 or secondary pattern target of 9.35.
An impulsive daily candle breakout and close above the monthly pivot at 13.75 will give us a target of 19.37. A breakout above wave b triangle resistance at 19.31 will add confidence to the count. Wave (v) of ((iii)) has a pattern target of 33.50.
*Target placement is not based on time. I only focus on the target levels.
12. Bitdeer Technologies Group ($BTDR)
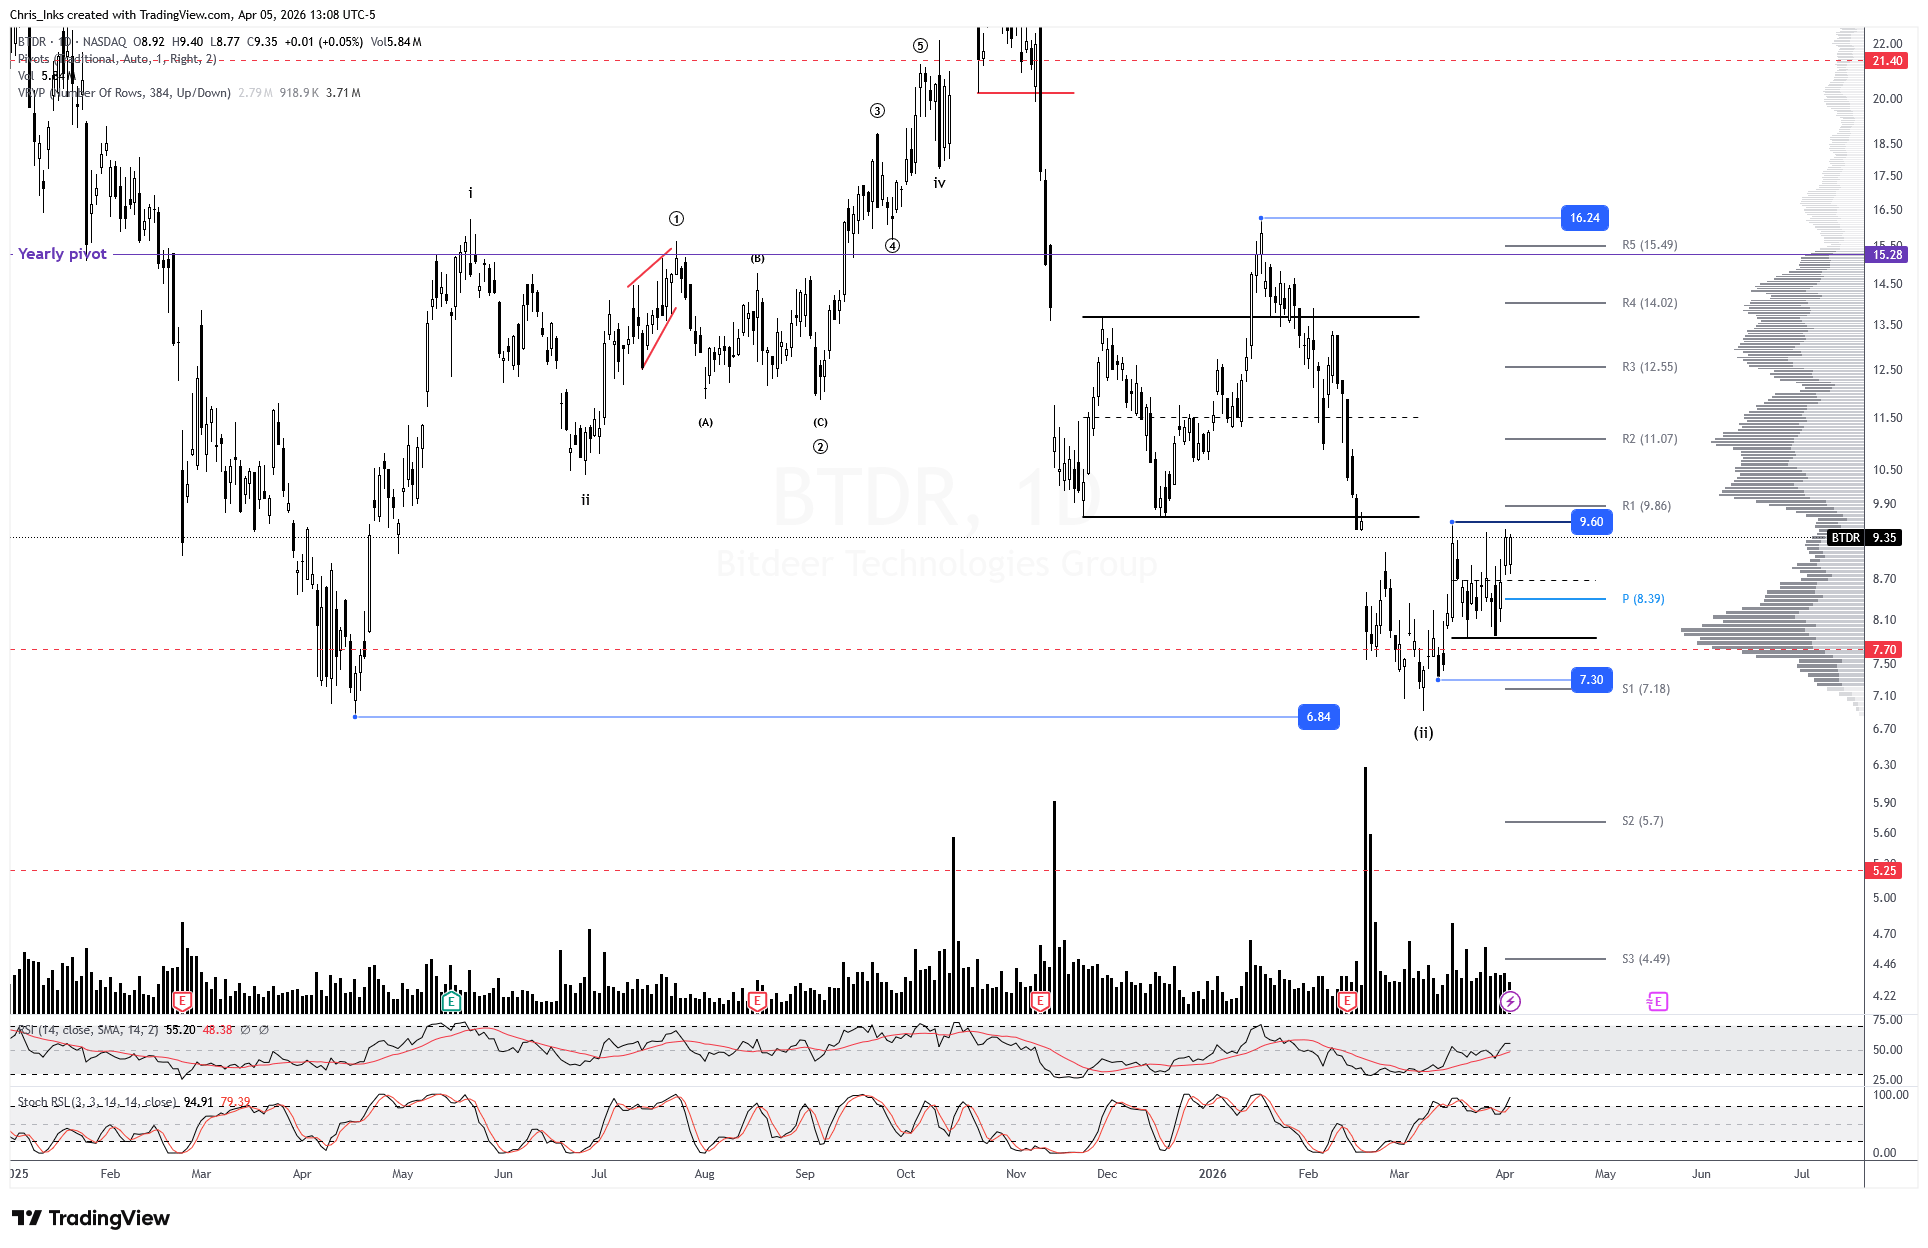
Price remains range bound locally, ending the week near the range resistance and above the monthly pivot. A breakdown below 7.30, without breaking out above the local range high at 9.60 first, will add confidence to the idea that the bounce off wave (ii) is corrective, and we should then expect price to break down further. Breaking down below 6.84 will indicate that the overall structure into the October 15, 2025 swing high was likely wave (i) as a leading diagonal, rather than just the most recent rally off 6.84, and that will give us a pattern target of ~5.25.
Further breakout above 16.24 will add confidence to the count and signal that wave (iii) is likely in progress.
*Target placement is not based on time. I only focus on the target levels.
13. Mawson Infrastructure Group Inc. ($MIGI)
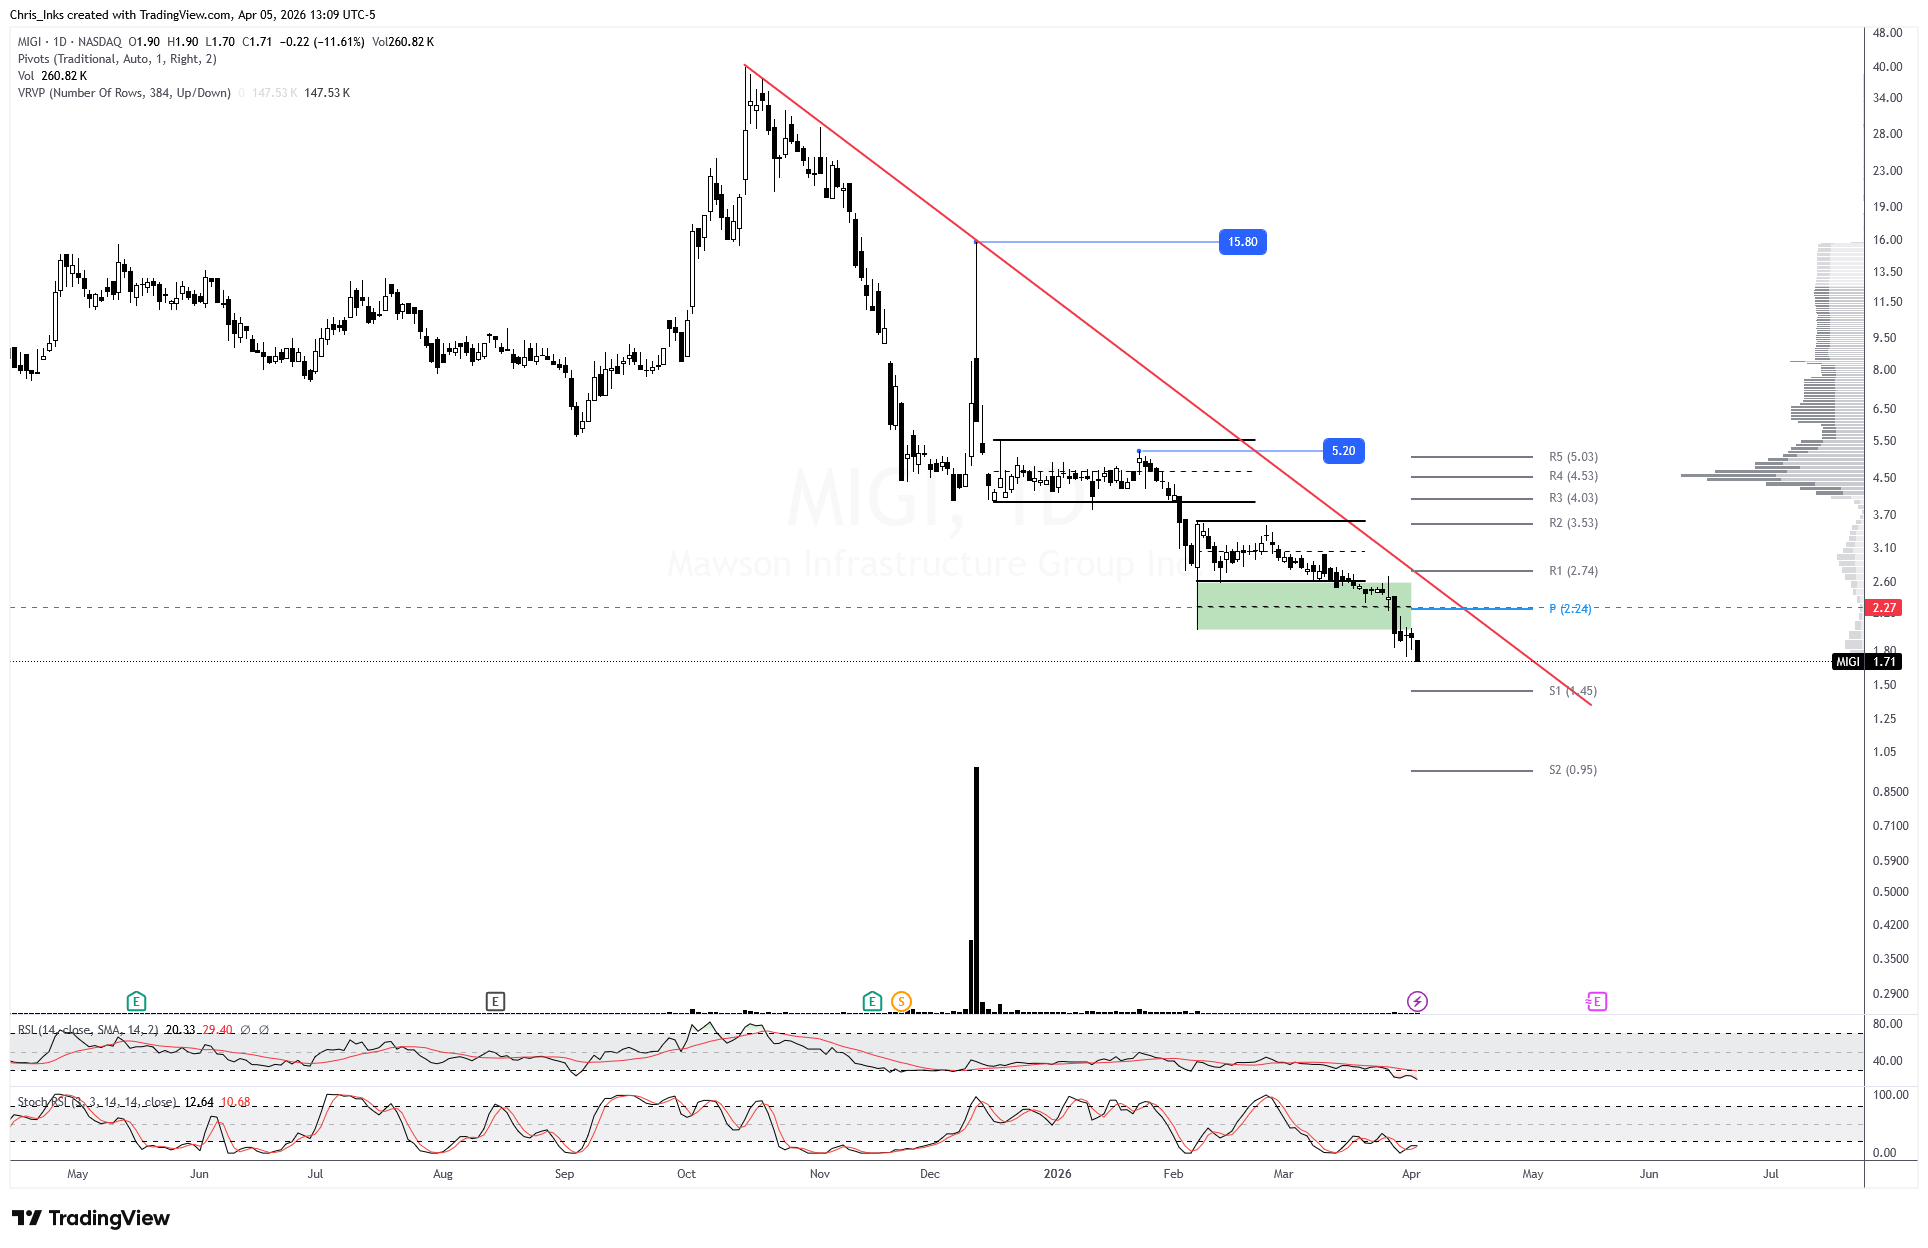
Price has continued to breakdown and may be targeting April’s monthly S1 pivot at ~1.45. An impulsive daily candle breakout and close above the descending red resistance will signal that the low is probably in. Further breakout above 5.20 will make it much more likely. But we need to see a breakout and close above the swing high at 15.80 to add real confidence to that idea.
*Target placement is not based on time. I only focus on the target levels.
14. Bit Digital Inc. ($BTBT)
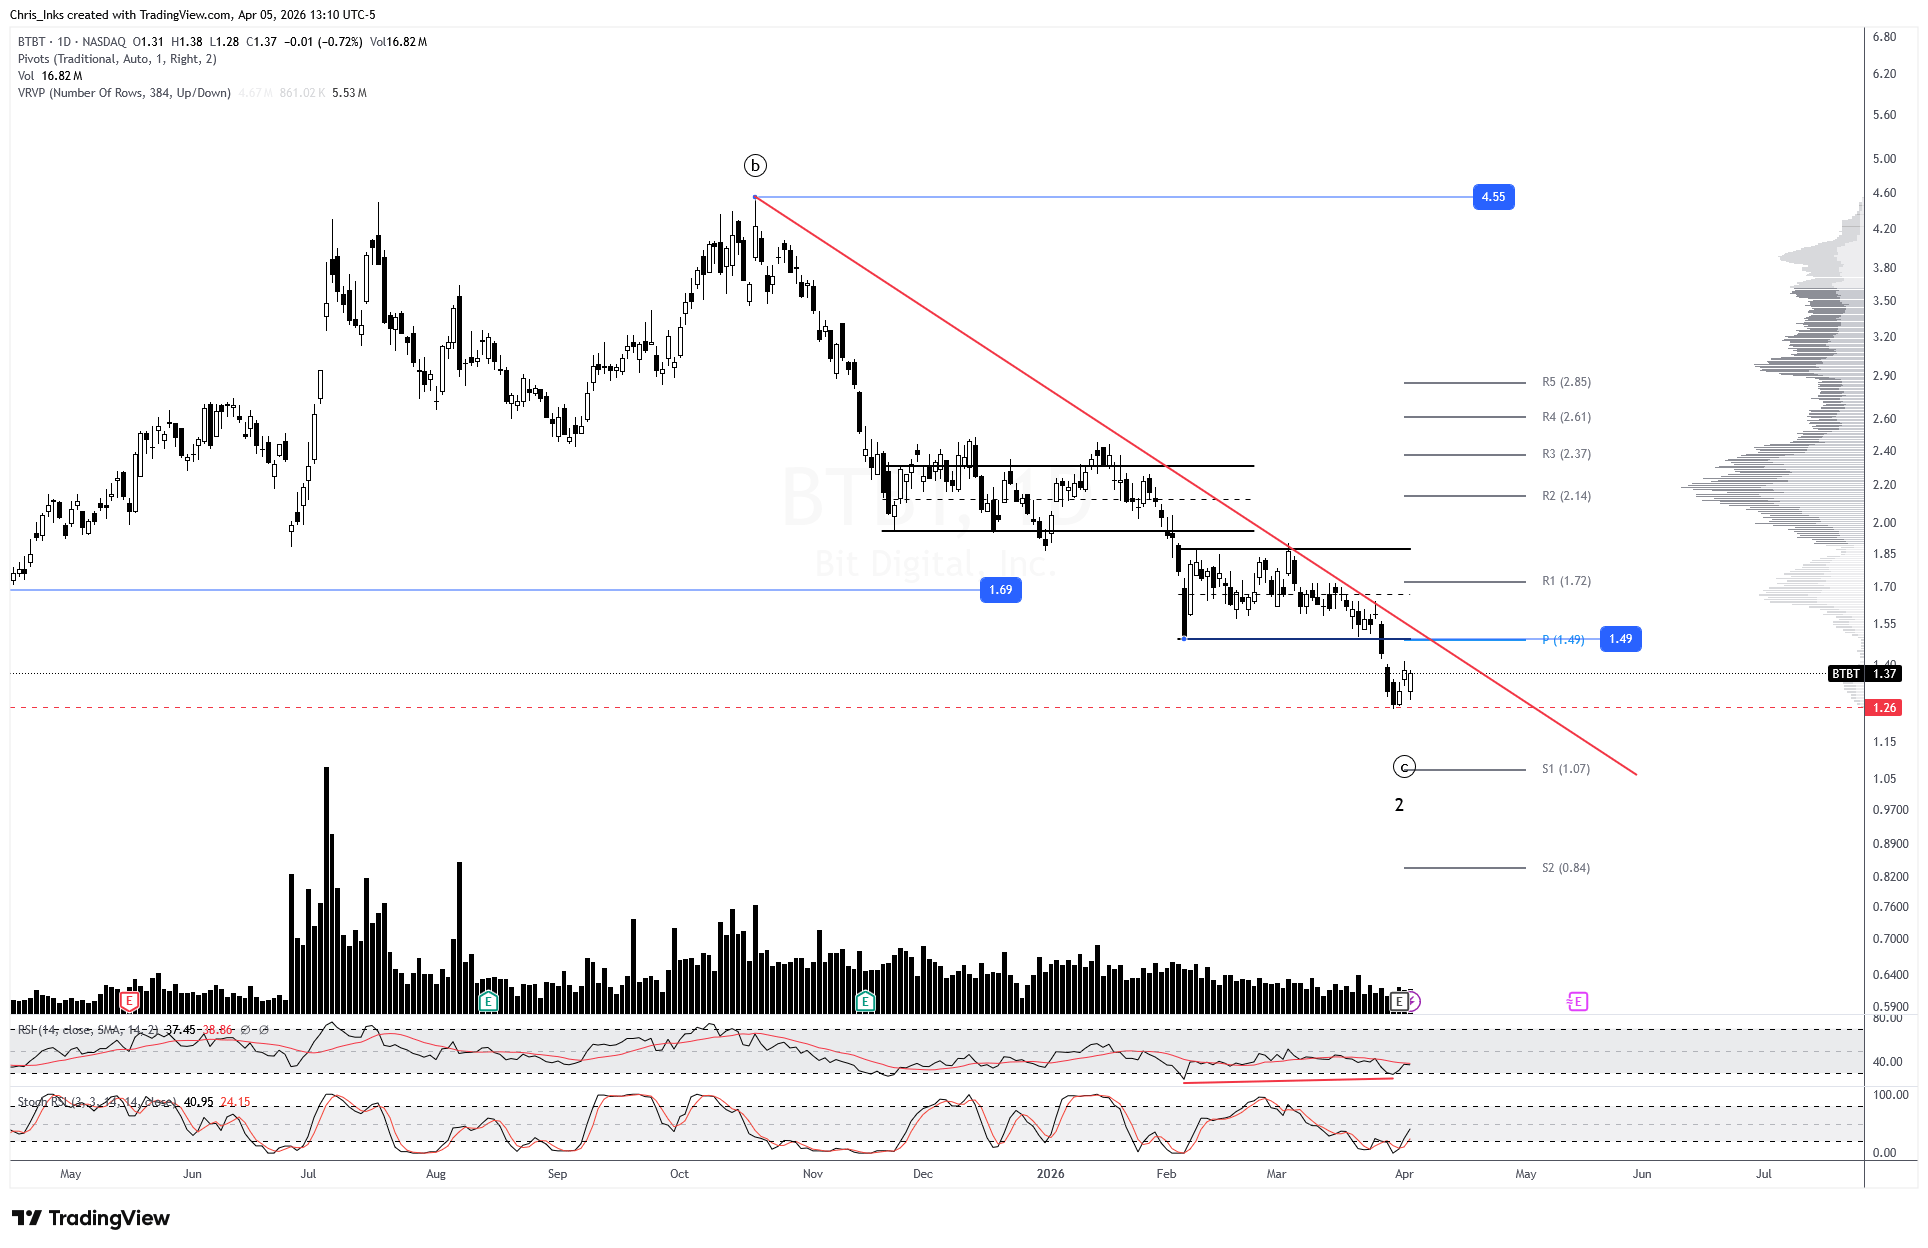
Price hit the downside pattern target of ~1.26 and bounced. It remains below the monthly pivot for now. An impulsive daily candle breakout and close above the descending red resistance will signal that the low may be in. Further breakout above wave ((b)) resistance at 4.55 will add confidence to the count. Wave 3 has a minimum expected target of 10.00.
Continued breakdown has a possible target of the monthly S1 pivot area at ~1.07.
*Target placement is not based on time. I only focus on the target levels.
15. Greenidge Generation Holdings Inc. ($GREE)
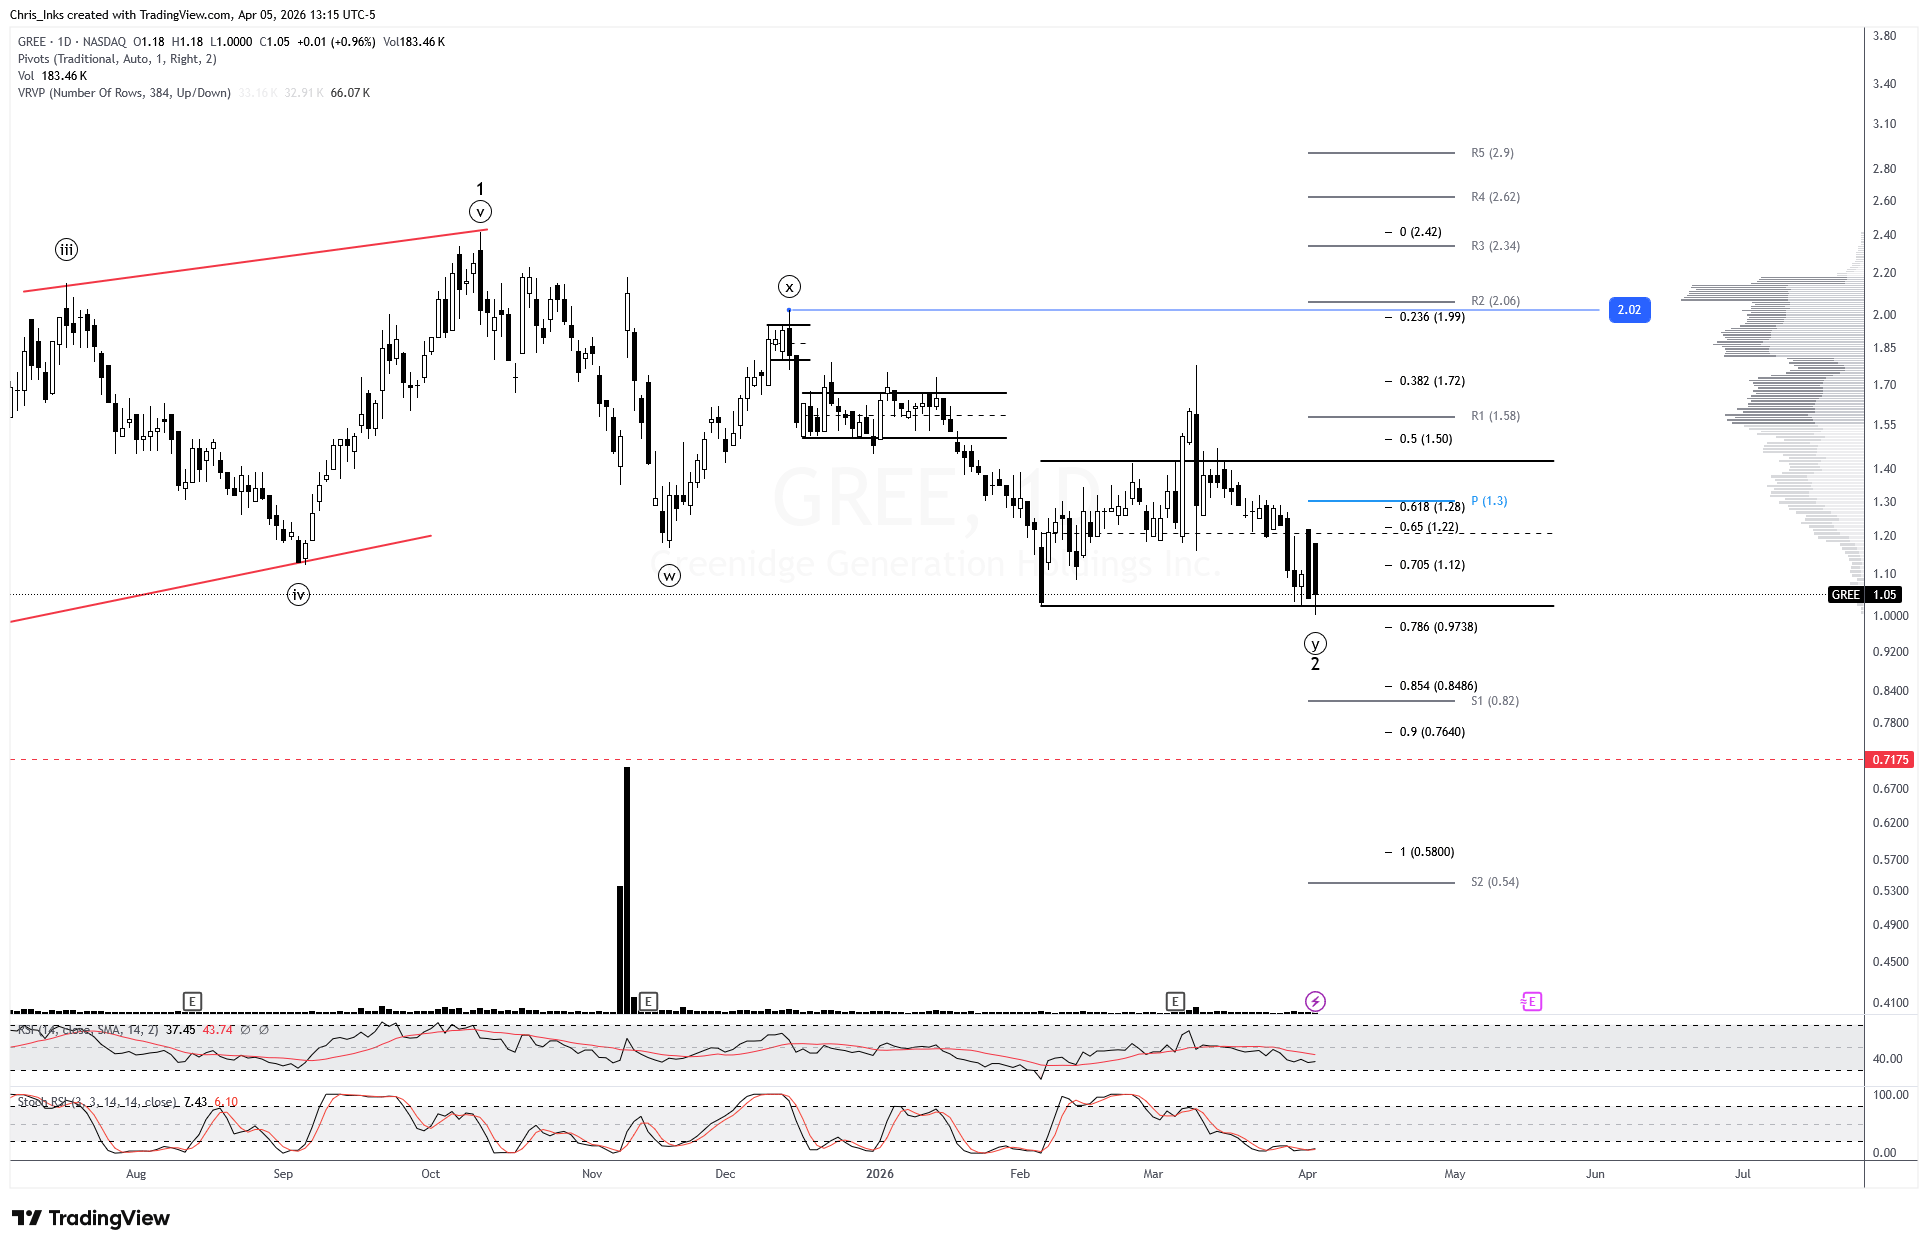
Price wicked below the wave 2 extreme, keeping wave 2 alive, but closed back inside the range. An impulsive daily candle breakout and close above the monthly pivot at 1.30 will signal that the low may be in. Further breakout above wave ((x)) resistance at 2.18 will add confidence to the count. Wave 3 has a minimum expected target of 4.00 and secondary target of 4.75.
Breaking down with price acceptance below wave 2, however, will keep wave 2 alive with an initial target of the monthly S1 pivot at 0.82 followed by a pattern target of 0.7175.
*Target placement is not based on time. I only focus on the target levels.
16. Ebang International Holdings Inc. ($EBON)
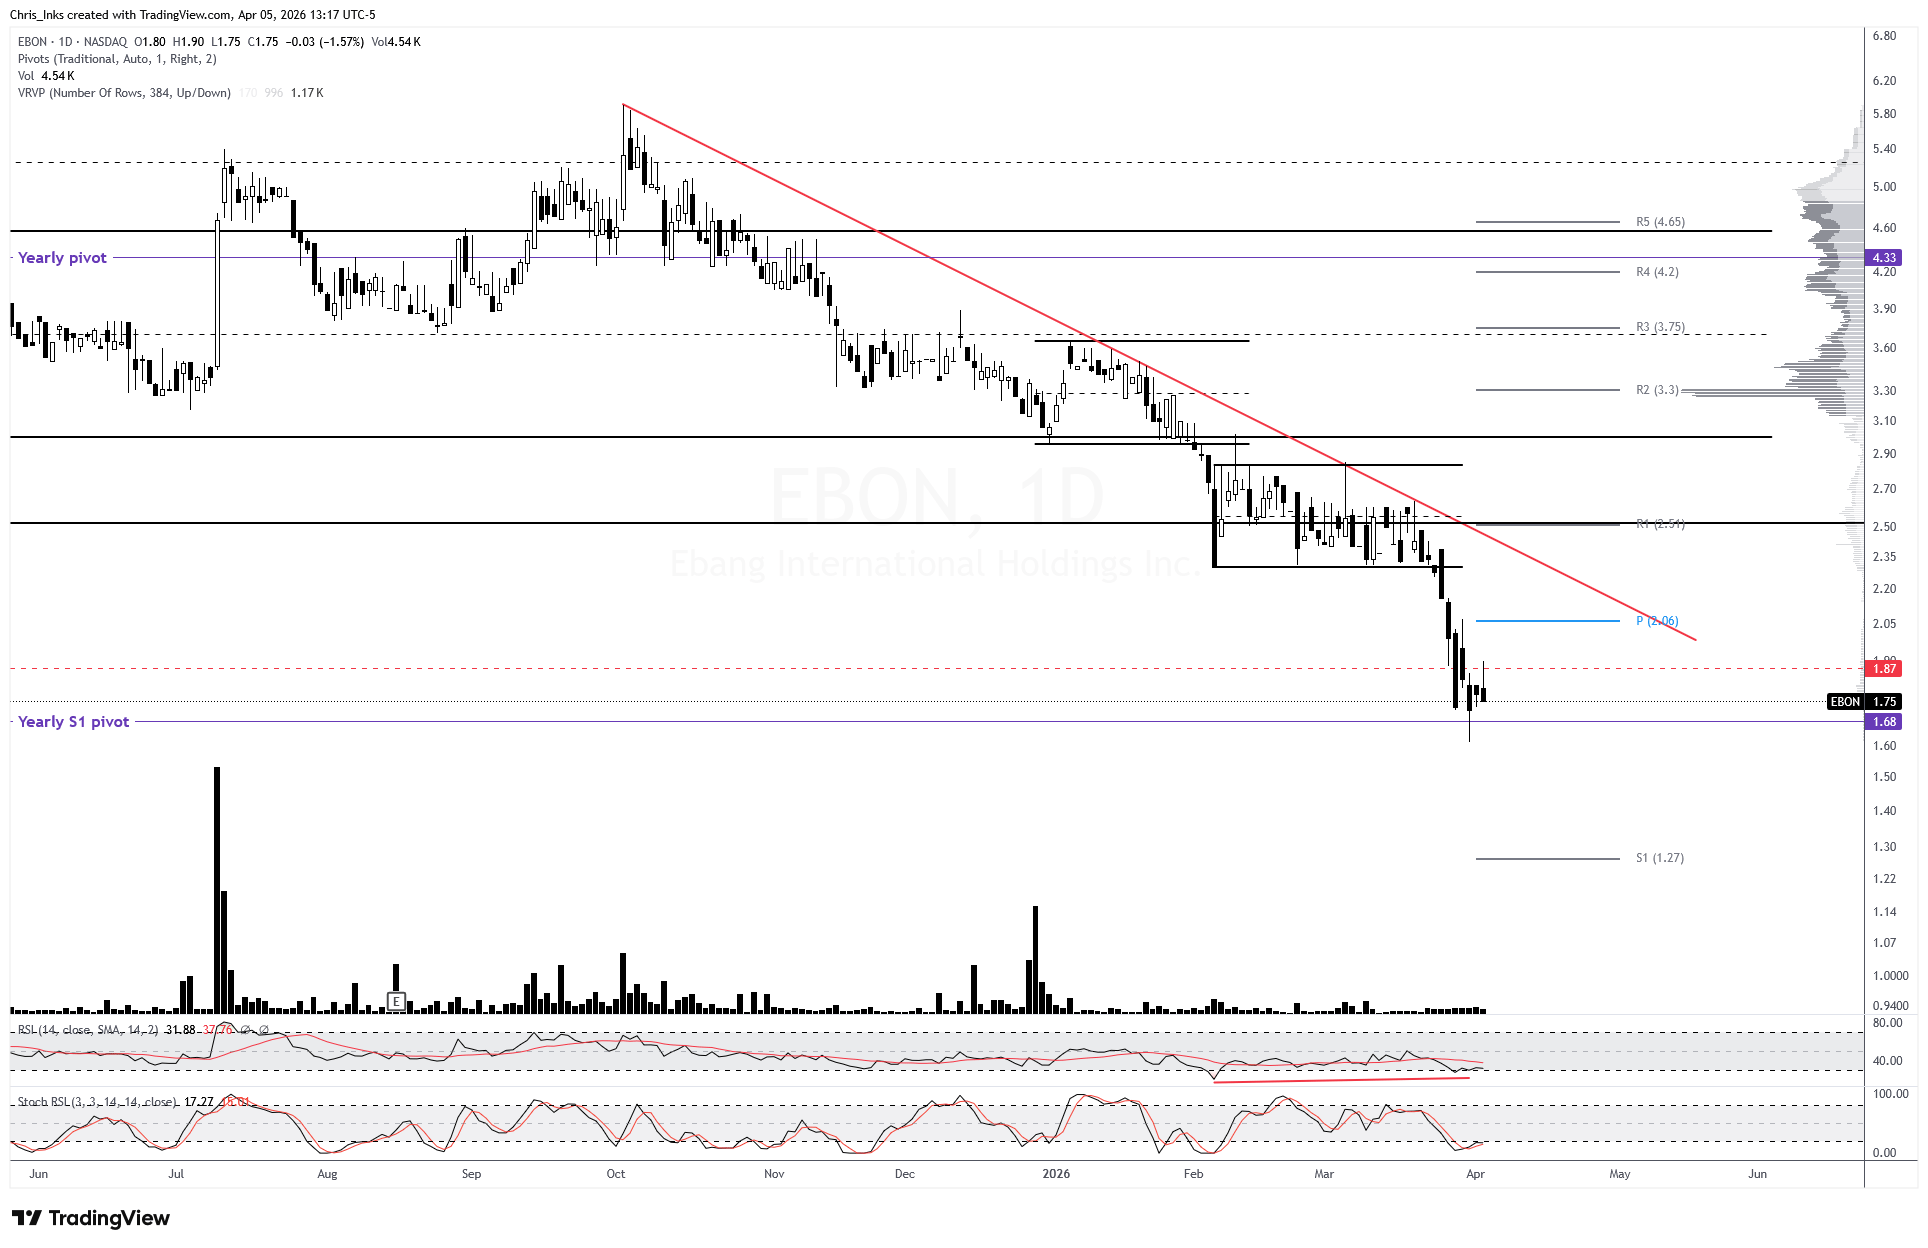
Price dipped lower once more into the yearly S1 pivot where it bounced off continued bullish RSI divergence in oversold. So, it’s looking like the decline may be over or nearly so.
An impulsive daily candle breakout and close above the descending red resistance will signal that the low may be in. That will give us a target of the yearly pivot at ~4.33.
*Target placement is not based on time. I only focus on the target levels.
17. Digi Power X ($DGXX)
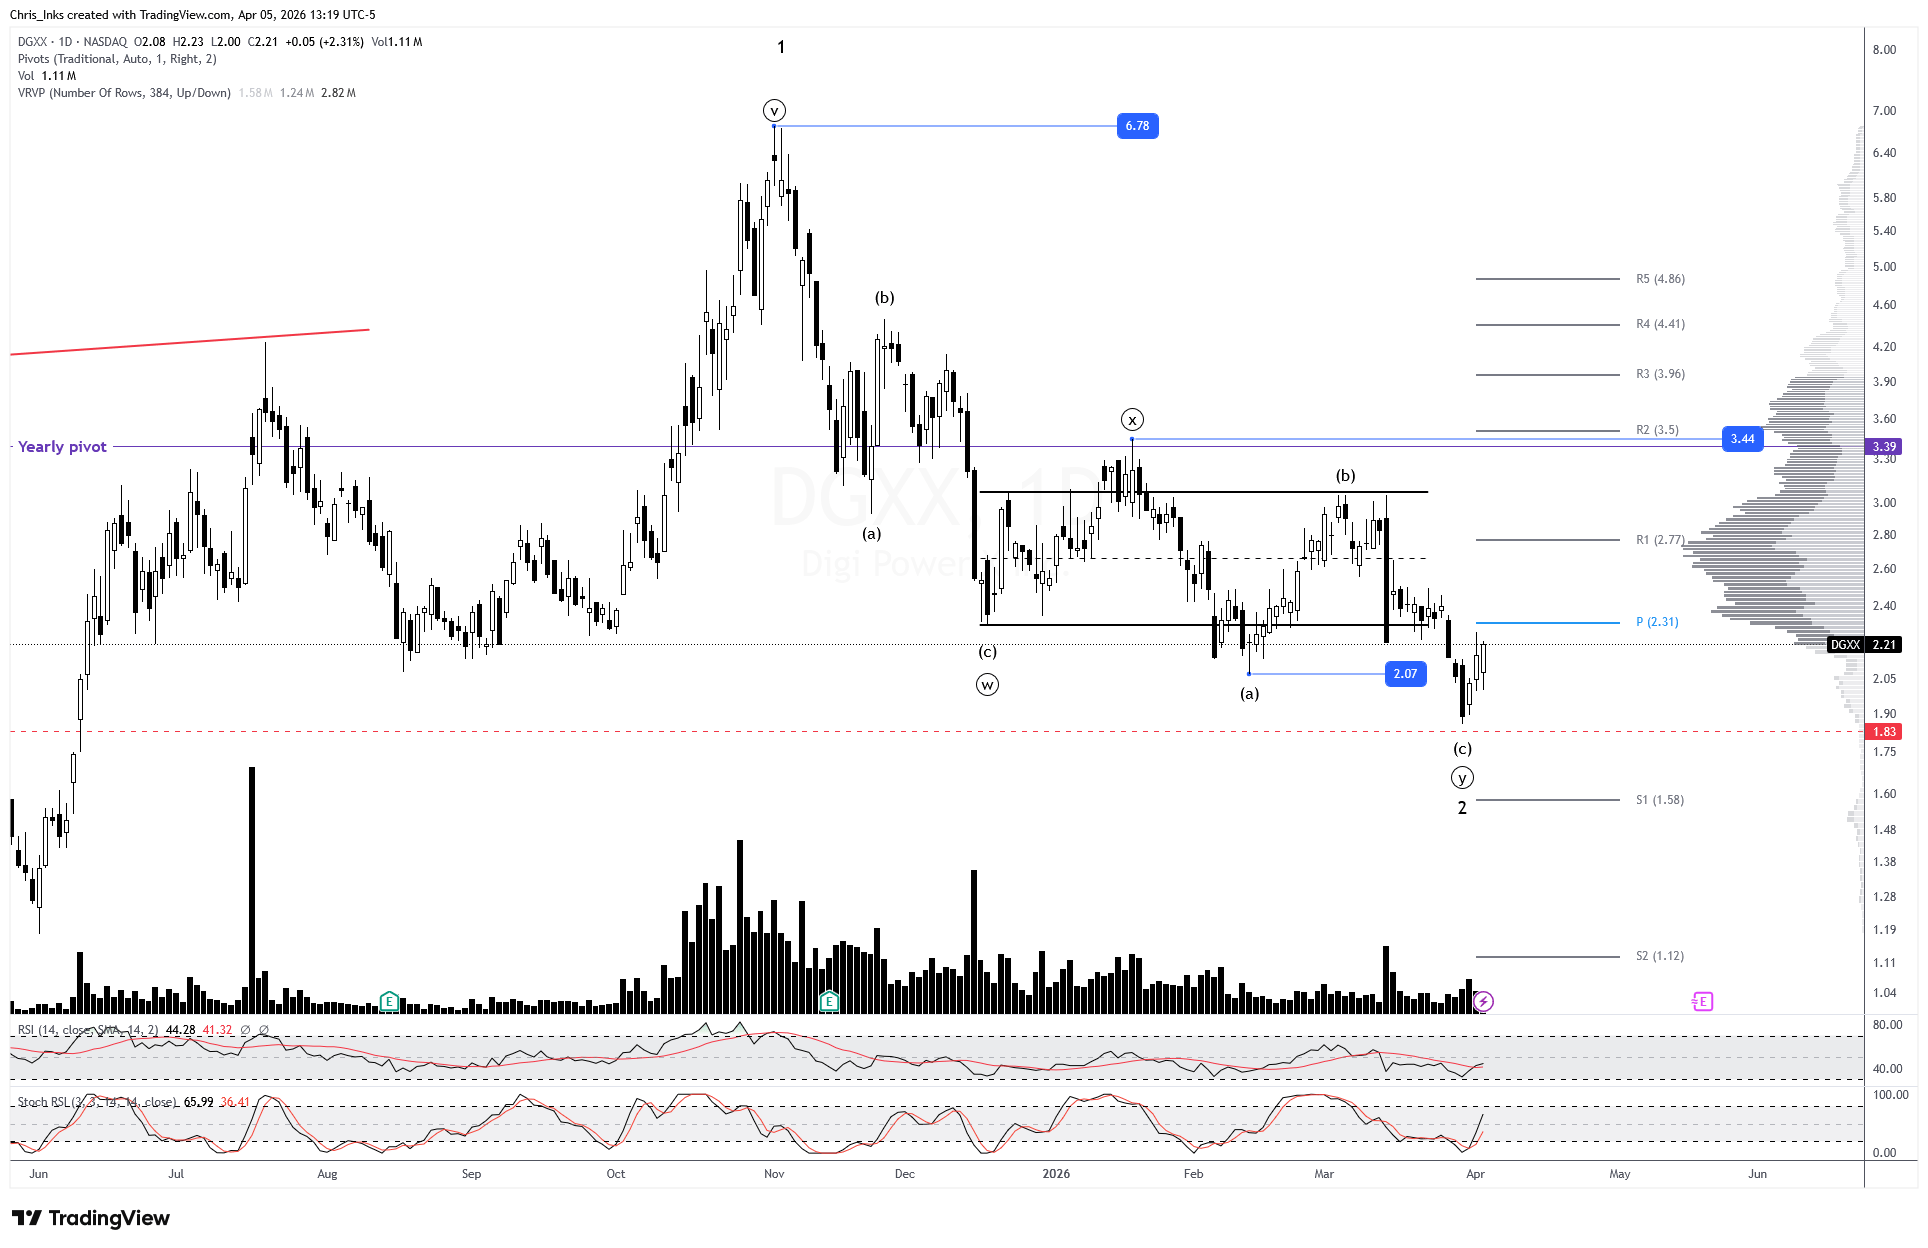
Price caught a bid and bounced just before the ~1.83 target. That bounce carried it into the monthly pivot which is holding as resistance for the moment.
An impulsive daily candle breakout and close above the monthly pivot at 2.31 will give us a target of 3.44. Further breakout above the wave ((x)) extreme at 3.44 will add confidence to the count. Wave 3 has a minimum expected target of 12.60 and secondary target of 15.00.
Breaking down further instead will keep wave 2 alive with a target of the monthly S1 pivot at 1.58.
*Target placement is not based on time. I only focus on the target levels.
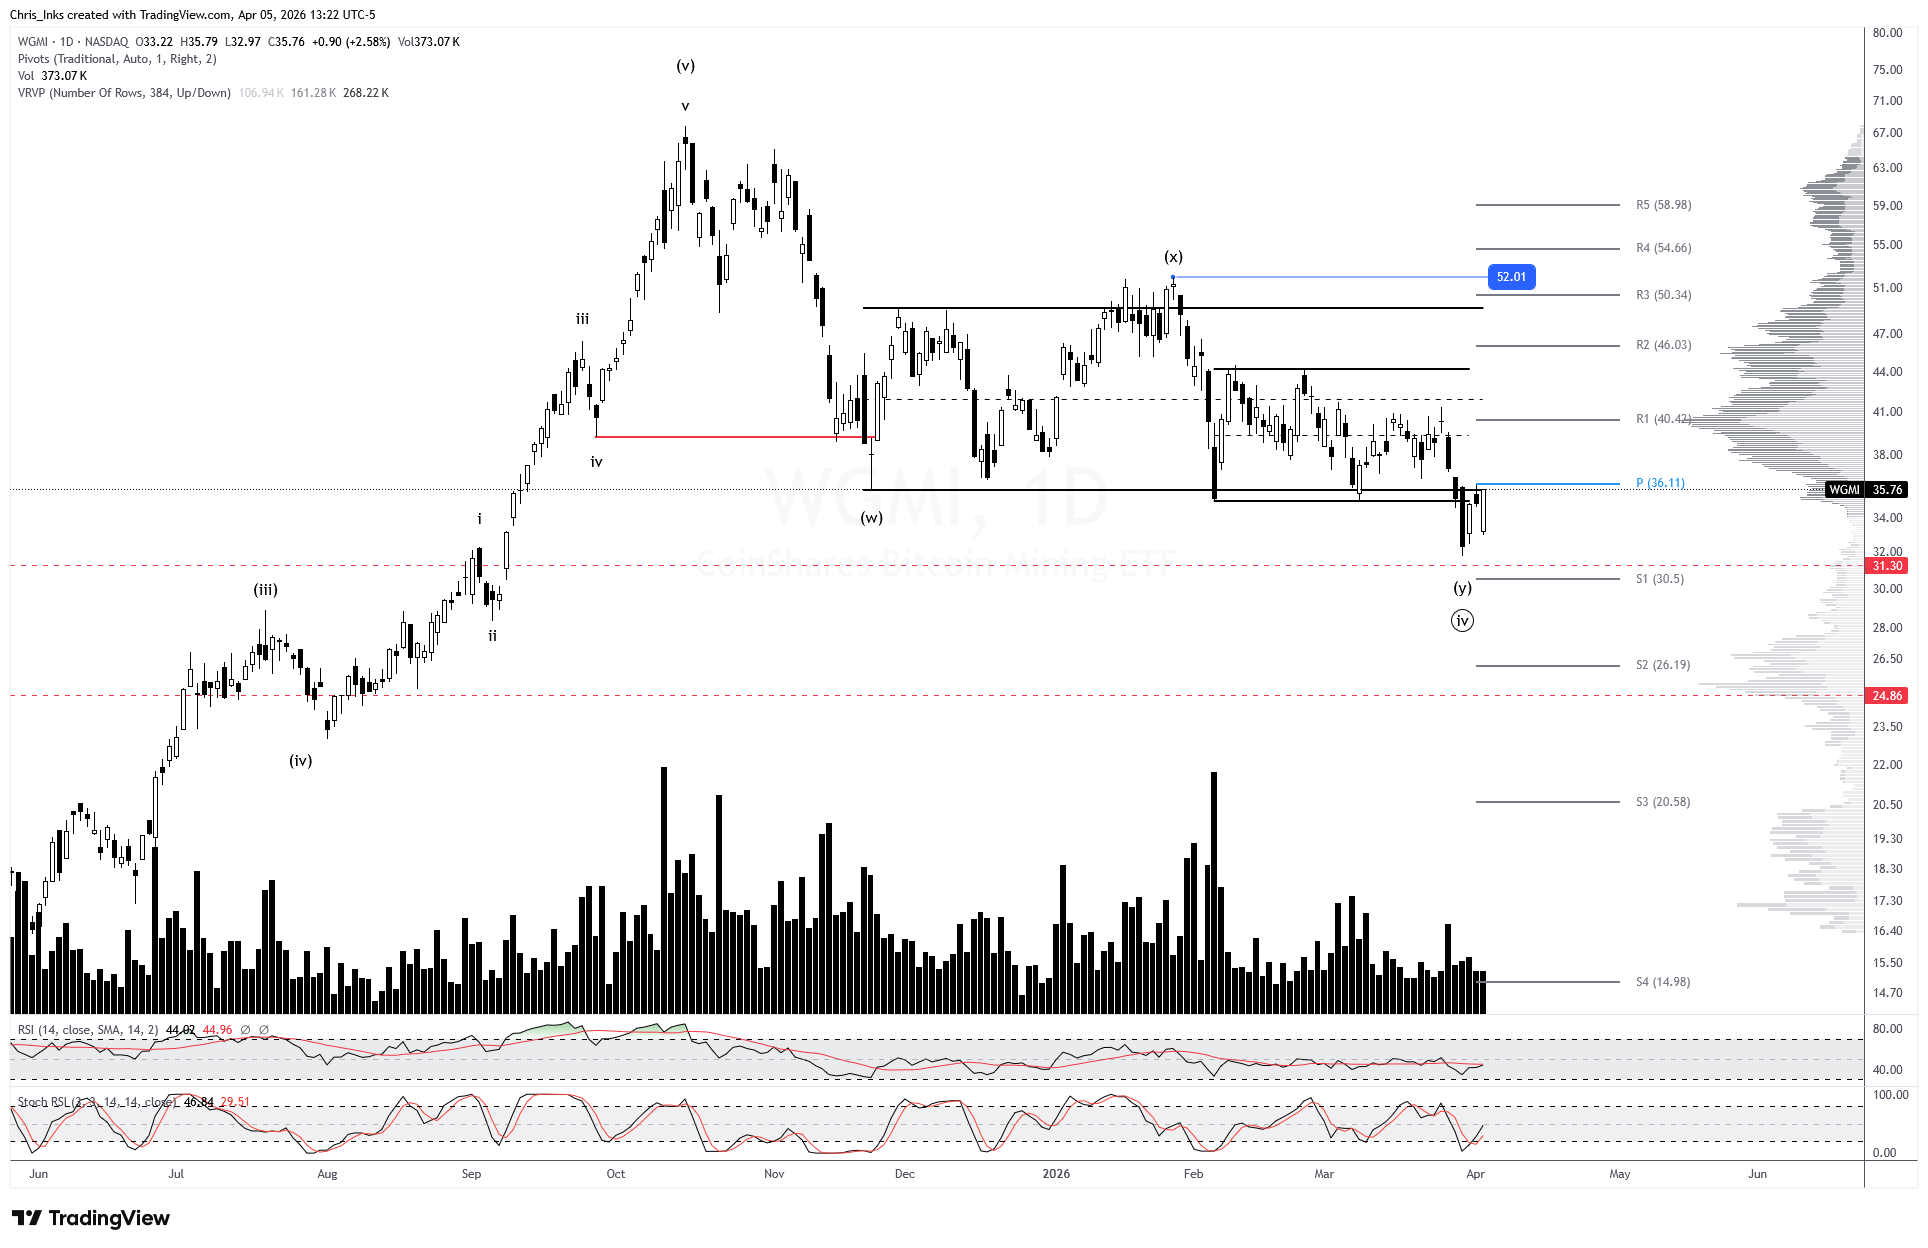
Price broke down lower and bounced from just above the initial local pattern target of ~31.30. But the monthly pivot is holding as resistance at 36.11 for now. Further breakdown has a secondary. larger pattern target of ~24.86.
An impulsive daily candle breakout and close above the monthly pivot will give us a target of 52.01. Further breakout above wave (x) resistance at 52.01 will add confidence to the count. Wave ((v)) has a pattern target of 89.00.
*Target placement is not based on time. I only focus on the target levels.
Hashpower & Geopolitics
Retarget up, economics still tight, and the power war gets more expensive
This past week gave miners a slightly harder network and no real margin miracle. Bitcoin difficulty increased 3.87% to 138.97T at the April 3 adjustment, and CoinWarz showed the network running with an average block time of about 11.02 minutes by Sunday, with the next adjustment already estimated lower, to roughly 126.14T, if current pacing holds. On the revenue side, Hashrate Index’s live dashboard showed spot hashprice around $30.39 per PH/s/day and 7-day network hashrate at 939.28 EH/s as of April 5. That’s the clean read. Difficulty ticked up, but miner pay per unit hash is still sitting in a tight, low-margin zone.
The more important network signal is that this was not just a bad week. It was a weak quarter. Reporting published this week said Bitcoin’s network hashrate fell 4% in Q1 2026, the first quarterly decline since 2020, as miners got squeezed by higher power costs and worsening economics. Tom’s Hardware, citing broader industry reporting, tied that deterioration to the Middle East energy shock, with crude up sharply and production costs for one bitcoin estimated around $88,000 versus a market price near $66,700 at the time of writing. That doesn’t mean every operator is underwater, but it does mean the industry is still being forced to choose between curtailment, treasury sales, or a pivot.
The geopolitics side is now showing up most clearly through energy, not just regulation. Reuters reported on April 2 that J.P. Morgan sees oil potentially moving to $120 to $130 in the near term, with a risk of above $150 if Strait of Hormuz disruptions persist into mid-May, while its base case still sees oil staying above $100 through Q2. For miners, that matters because energy inflation is not some abstract macro backdrop. It feeds directly into hosting prices, power contracts, and the cost curve that determines who can stay online when hashprice is only around thirty bucks.
Meanwhile, the competition for power got louder this week in West Texas. Reuters reported that Microsoft, Chevron, and Engine No. 1 signed an exclusivity agreement tied to a proposed 2,500 MW natural-gas-fired power plant and data center campus in West Texas, with the project reportedly carrying a roughly $7 billion price tag. That is not “AI hype” in the abstract. That is hyperscale demand moving directly into the same power geography miners have been trying to monetize. It tells you the next valuation fight is not just about exahash. It is about who controls megawatts, interconnection, and the right counterparties.
The public miner tape backed that up. Riot reported on April 2 that it produced 1,473 BTC in Q1 but sold 3,778 BTC for $289.5 million in net proceeds, ended the quarter with 15,680 BTC held, and generated $21.0 million in total power credits. Riot’s annual-report disclosures also showed that falling bitcoin prices forced it to post more collateral against its Coinbase credit facility, with 5,802 BTC classified as restricted by March 31. That is real pressure, not narrative pressure. The company is still mining, but it is also monetizing treasury, leaning on credits, and tightening collateral as it pushes deeper into the data center buildout story.
Bitfarms delivered the cleaner strategic reframe. On April 1, it officially completed its U.S. redomiciliation and rebranded as Keel Infrastructure. In its March 31 results, the company said it had about $520 million of liquidity as of March 27, including roughly $161 million in unencumbered bitcoin, and it laid out a 2.2 GW North American development pipeline. Separate reporting this week indicated management intends to sell bitcoin opportunistically to reinvest into HPC and AI infrastructure rather than keep playing full-time treasury maximalist. That is the industry in one sentence: fewer miners pretending they are just miners.
Why it matters: the market is still in a regime where a small difficulty increase hurts, a small drop in energy costs helps, and treasury management suddenly matters a lot more than slogans. This week’s combination of 138.97T difficulty, roughly $30.39 hashprice, a 4% quarterly hashrate decline, and rising energy stress says the same thing from four different angles: pure mining economics remain tight, and the stronger players are increasingly behaving like power and infrastructure companies first.
Actionable angle: in the next round of monthly updates and earnings calls, watch two disclosures. First, whether miners explicitly quantify how much of their fleet is economic in a $30 to $31 hashprice band without leaning on curtailment credits to dress it up. Second, whether AI and HPC pivots come with hard power facts, not pretty slideware: megawatts, counterparties, interconnection status, and funding source. Riot’s BTC sales and collateral top-up, and Keel’s rebrand plus pipeline math, are the kind of disclosures that actually separate survival from theater.
Signal stat: Bitcoin difficulty reset up 3.87% to 138.97T on April 3, while Hashrate Index showed spot hashprice at $30.39 per PH/s/day and 7-day hashrate at 939.28 EH/s on April 5.
Beards and Bitcoin simulcasting on Wednesdays at 11:00 a.m. CST
Market Analysis simulcasting on Fridays at 11:00 a.m CST
DISCLAIMER: This newsletter is intended solely for educational purposes and should not be construed as financial advice. It does not constitute an investment recommendation or a solicitation to buy or sell any assets. Please exercise due diligence and conduct your own research before making any financial decisions.
The Bitcoin Miner Stocks Report does not operate as a registered investment advisor. This document is provided purely for informational purposes and does not constitute an offer or invitation to buy or sell any financial instruments. The viewpoints expressed are derived from historical data analysis and are deemed reliable, though their accuracy is not assured. Readers are entirely accountable for any decisions made based on this information.
CFTC RULE 4.41 - These results are based on simulated or hypothetical performance results that have certain inherent limitations. Unlike the results shown in an actual performance record, these results do not represent actual trading. Also, because these trades have not actually been executed, these results may have under-or over-compensated for the impact, if any, of certain market factors, such as lack of liquidity. Simulated or hypothetical trading programs in general are also subject to the fact that they are designed with the benefit of hindsight. No representation is being made that any account will or is likely to achieve profits or losses similar to these being shown.
Reply